Bitcoin Battles Key Resistance After Institutional Buying Slows
As Bitcoin dips below $60,000, the market watches closely to see if the cryptocurrency can reclaim its momentum or if a deeper correction is on the horizon | That's TradingNEWS
Institutional Influence on Bitcoin (NASDAQ: BTC) Prices
Institutional Accumulation and Its Impact on Bitcoin Prices
The recent fluctuations in Bitcoin's (NASDAQ: BTC) price can largely be attributed to the movements of institutional investors. Over the past two days, there has been a noticeable halt in the accumulation of stablecoins by these investors, which has led to a drop in Bitcoin’s price below the key psychological level of $60,000. As of 08:03 am UTC on August 12, Bitcoin traded at $58,930, a decline of 3.9% from its weekly high of $62,510. This dip has raised concerns among investors about the ongoing market sentiment.
The halt in stablecoin inflows, particularly Tether (USDT), to cryptocurrency exchanges has been a significant factor in this price movement. Tether minted over $1.3 billion worth of stablecoins between August 5 and August 9, which coincided with a 21% recovery in Bitcoin's price from its five-month low of $49,500 to above $60,000. However, the cessation of these inflows has led to a lack of buying pressure, causing Bitcoin to struggle to maintain its earlier gains.

Technical Analysis: Bitcoin's Critical Resistance Levels
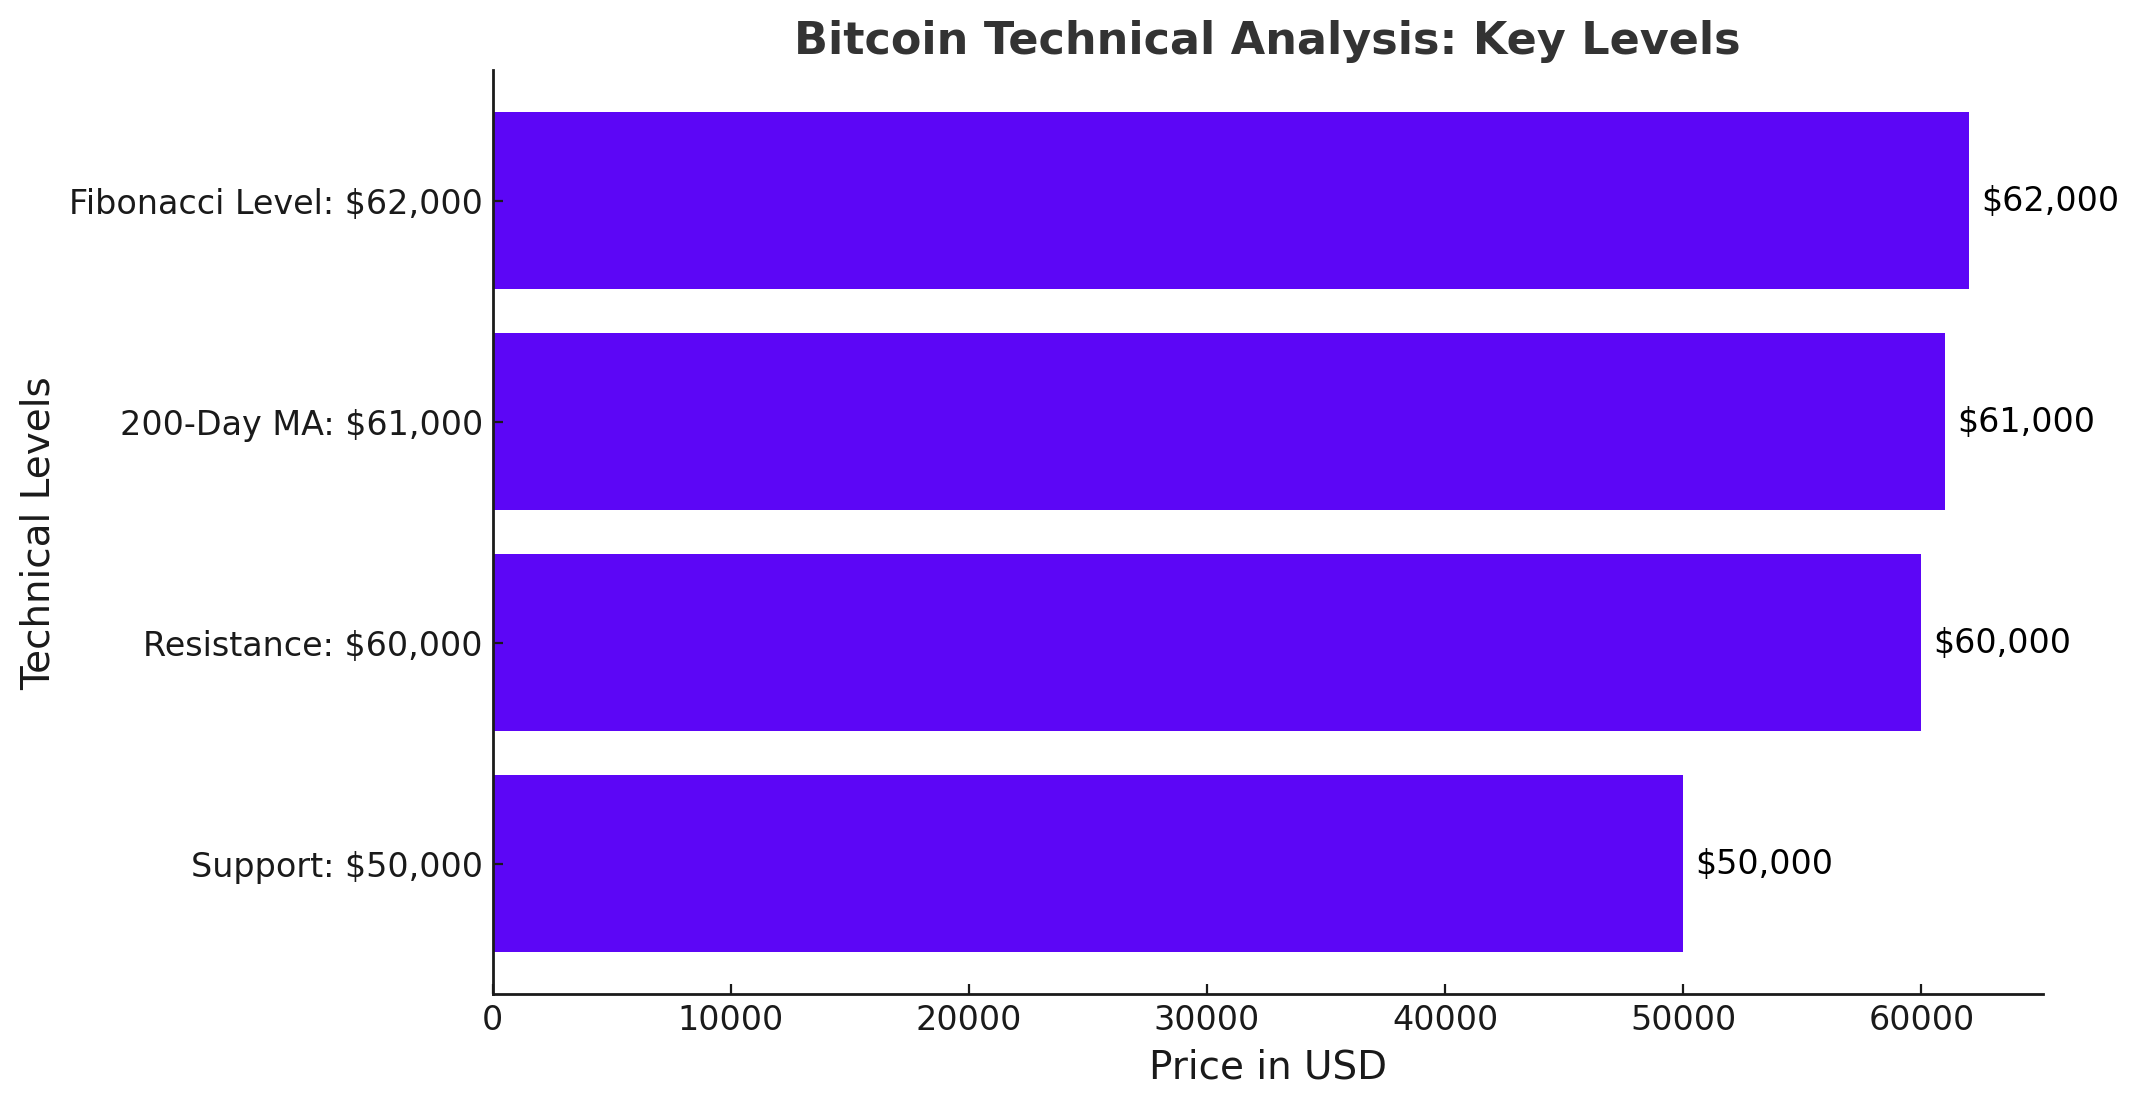
Bitcoin's technical analysis suggests that the price is currently testing a crucial resistance level around $60,000 to $62,000. The price action near this resistance zone will be pivotal in determining Bitcoin's next major move. The 200-day moving average at $61,000, combined with the psychological resistance at $60,000, has created a challenging barrier for Bitcoin.
On the daily chart, Bitcoin shows increased buying pressure near the $50,000 support region, leading to a significant bullish rebound. However, the resistance around $61,000 could trigger substantial selling pressure, potentially halting further upward momentum. If Bitcoin fails to break through this resistance, it could complete a pullback, leading to another bearish leg toward the critical $50,000 threshold.
The four-hour chart further highlights the significance of the $59,000 to $62,000 range, marked by the 0.5 ($59,000) and 0.618 ($62,000) Fibonacci levels. A rejection at this level could result in a continuation of the bearish trend, while a successful break above could trigger an impulsive surge, potentially driven by a short-squeeze event.
On-Chain Analysis: Whale Activity and Market Sentiment
Whales, or large holders of Bitcoin, play a crucial role in influencing price movements. The current on-chain data shows that Bitcoin has dipped below the realized price levels of short-term whales, falling toward the $49,000 to $50,000 range. However, there has been a demand rebound, with Bitcoin's price now retracing toward the short-term whale realized price range of $64,000 to $65,000.
This price region is critical as it could act as substantial resistance. Some whales may look to exit their positions as they approach breakeven levels, potentially triggering selling pressure. The price action in this area will be key in determining Bitcoin’s market direction in the coming days. If sellers dominate, it could signal a continuation of the bearish trend; otherwise, a successful break above this resistance could lead to renewed bullish momentum.
Broader Market Conditions and Bitcoin’s Future Outlook
The broader cryptocurrency market has also been affected by recent developments, contributing to Bitcoin's price volatility. The crypto market as a whole saw a 3.18% drop in value over 24 hours, with Bitcoin falling by 3.8% to $58,315. Despite a 7.53% increase in trading volume, Bitcoin has lost 13.9% over the past two weeks.
This decline is part of a broader context of market volatility, where the DeFi sector has also suffered significant losses. The market capitalization decrease of over $2 trillion in the DeFi space has exacerbated concerns among investors already worried about economic and geopolitical uncertainties.
However, there is hope among investors for a quick recovery, similar to the recent rebound where Bitcoin rose by 6% after a sharp decline. This potential recovery could restore confidence and stabilize the market, but investors must remain cautious, given Bitcoin's notorious unpredictability.
Conclusion: Navigating Bitcoin’s Volatile Market
Bitcoin's recent price movements highlight the ongoing volatility in the cryptocurrency market. Institutional activity, technical resistance levels, whale behavior, and broader market conditions all play critical roles in shaping Bitcoin's price trajectory. Investors must remain vigilant and consider these factors when navigating the market, as Bitcoin continues to test key resistance levels that will determine its future direction.
As of now, Bitcoin’s price action near the $60,000 to $62,000 resistance zone is crucial. A successful break above could signal renewed bullish momentum, while failure to do so may lead to a continuation of the bearish trend, potentially revisiting the $50,000 support level. Investors should closely monitor these developments and adjust their strategies accordingly to manage the inherent risks in this volatile market.
That's TradingNEWS
Read More
-
QQQ ETF Price Forecast - QQQ at $600.91: Nasdaq Growth Weighs Jobs Shock, High Yields and AI Productivity
12.02.2026 · TradingNEWS ArchiveStocks
-
XRPI And XRPR ETF Prices Lag At $7.74 And $11.44 While $1.23B XRP ETF Flows Test A Weak $1.38 Spot
12.02.2026 · TradingNEWS ArchiveCrypto
-
Gold Price Forecast: XAU/USD Guards $5,000 as Wall Street Maps Run Toward $6,100–$7,200
12.02.2026 · TradingNEWS ArchiveCommodities
-
EUR/USD Price Forecast: Can the Euro Clear 1.1900 as Dollar Momentum Fades Below 97?
12.02.2026 · TradingNEWS ArchiveForex


