Bitcoin Teeters on $54,000 Support: Is a Major Drop or Rebound Ahead?
With institutional outflows and waning user activity, Bitcoin faces a critical juncture. Can BTC hold its ground, or is a deeper correction imminent? | That's TradingNEWS
Bitcoin Struggles Amidst Market Uncertainty: Is BTC Heading Lower or Primed for Rebound?
Institutional Outflows and Falling Active Addresses Signal Bearish Pressure for BTC
The recent movements in Bitcoin (BTC) prices have been anything but predictable. After a volatile week that saw Bitcoin's value plummet to as low as $54,000, BTC seems to have stabilized between $54,000 and $55,000, creating a battleground between bulls and bears. This price consolidation comes in the wake of U.S. job reports that triggered massive long liquidations, with over $220 million wiped off the market in a single day.
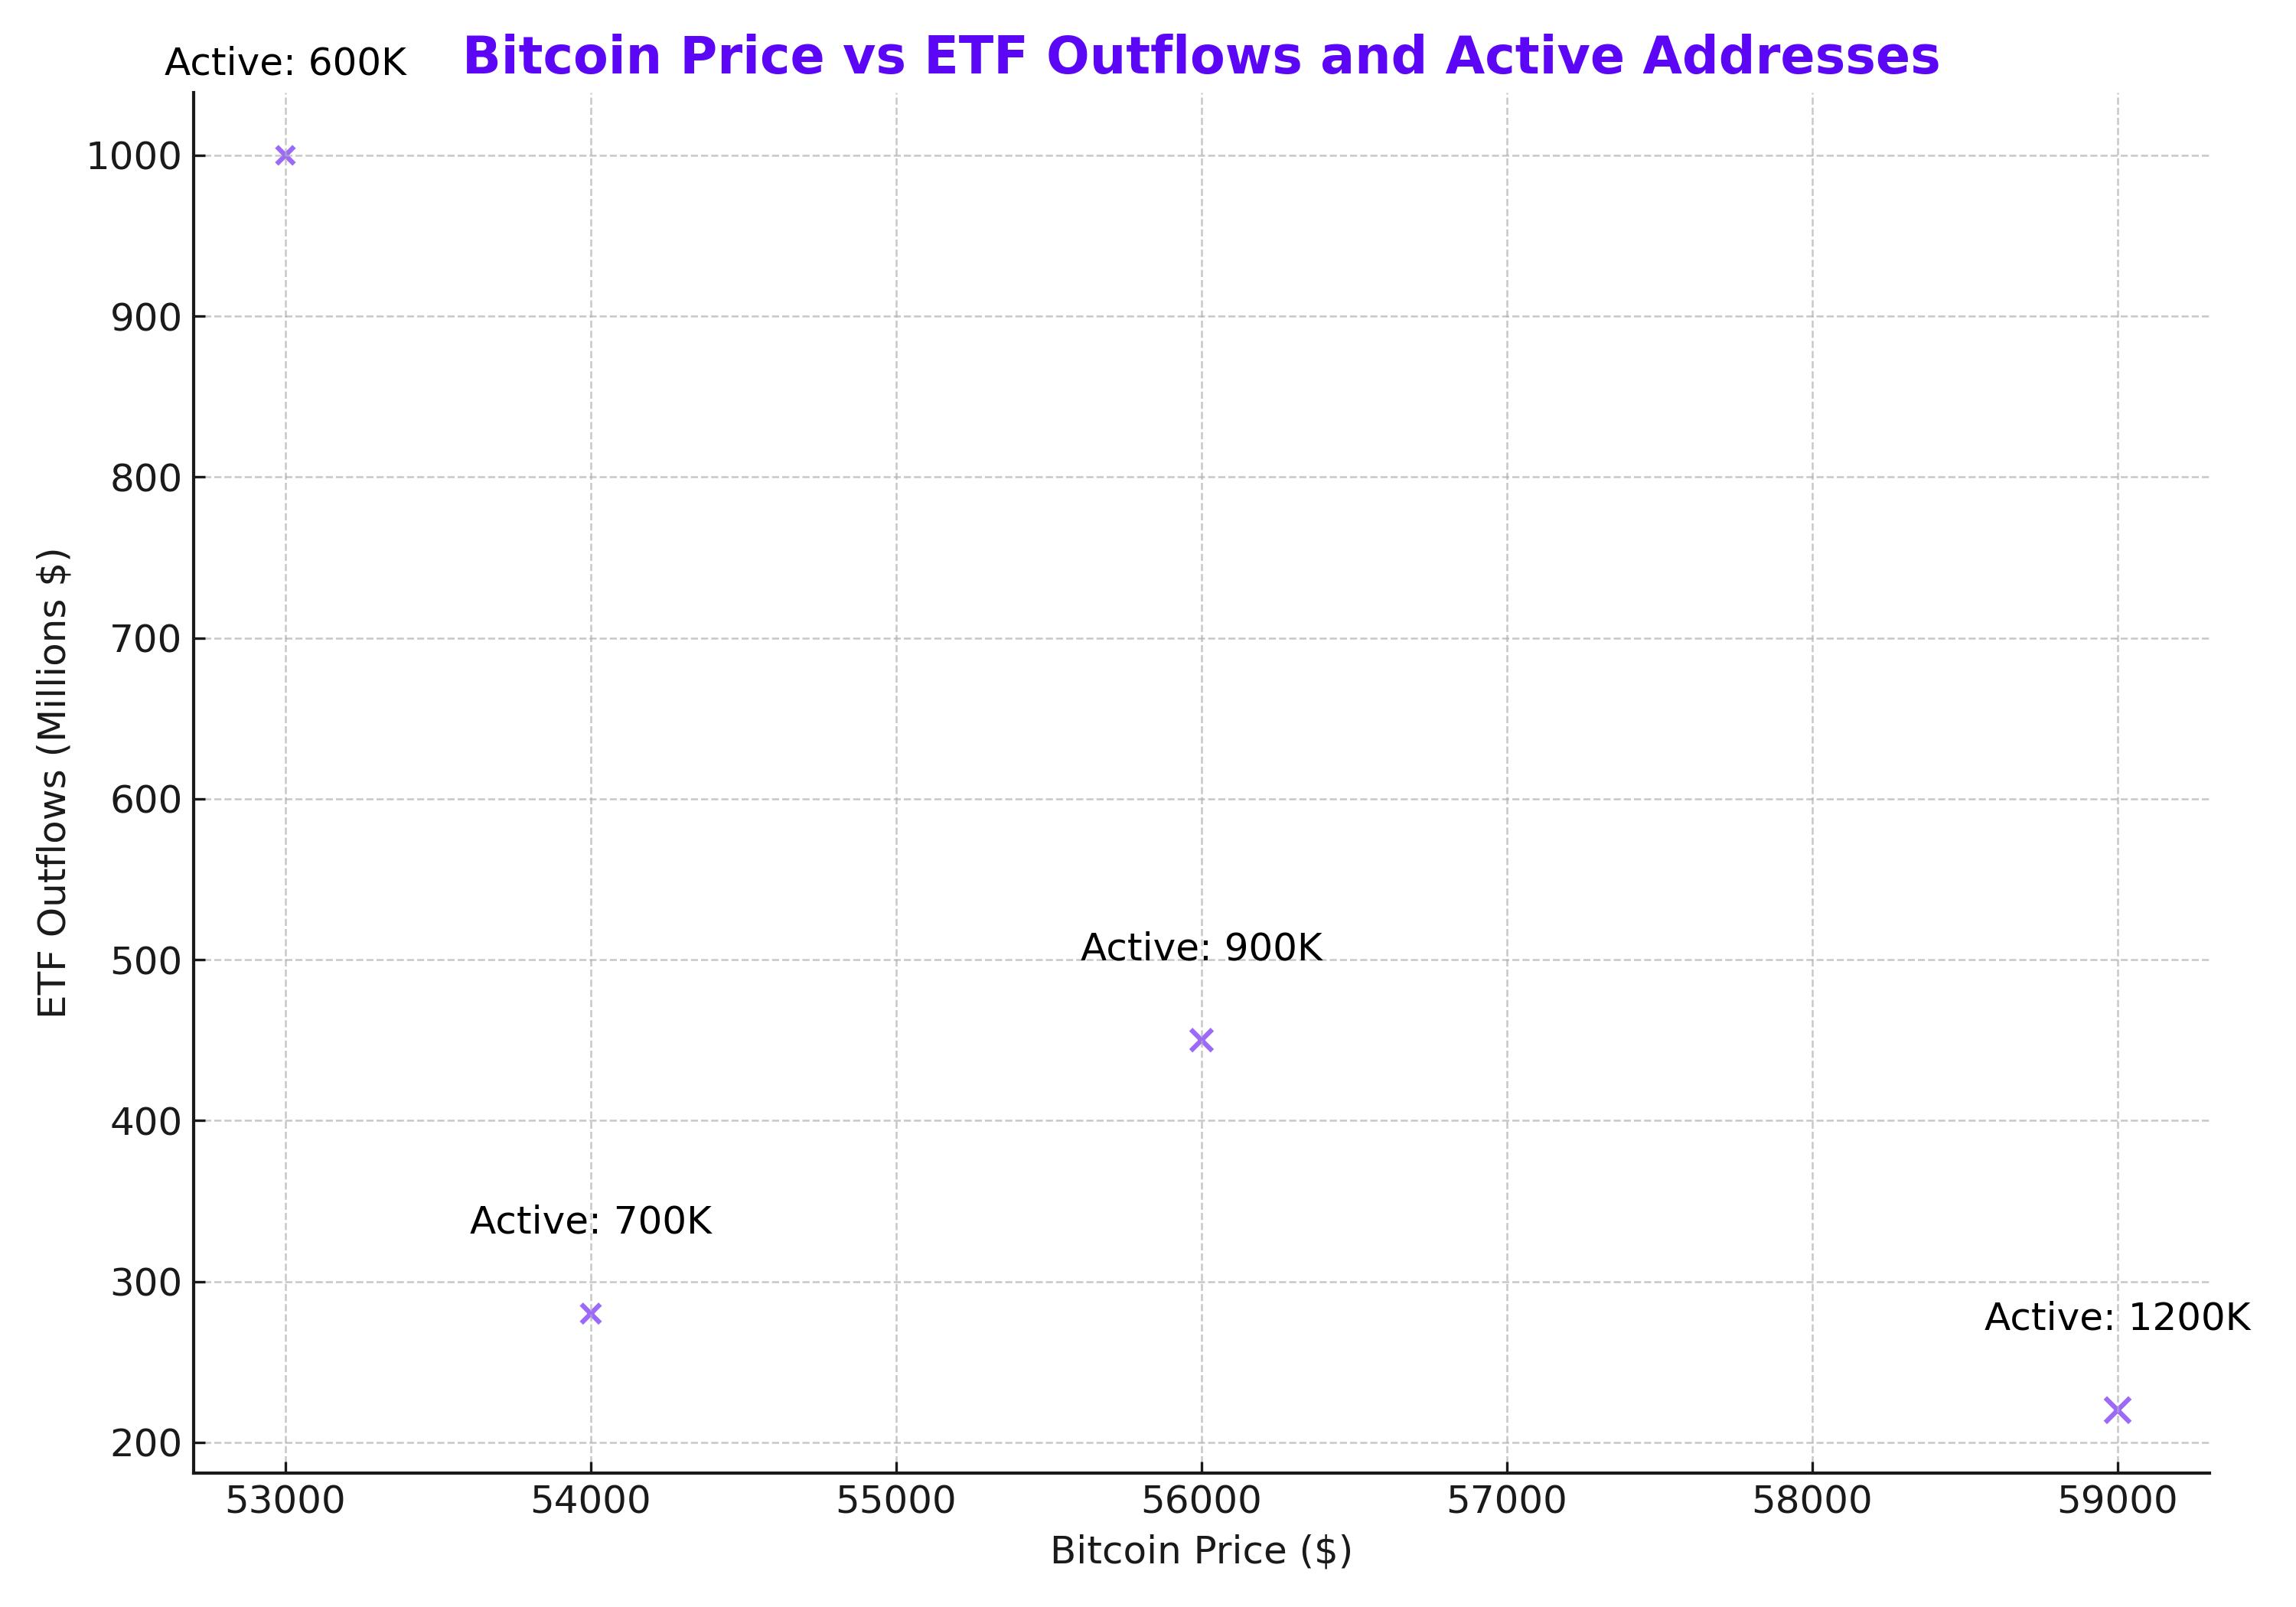
A detailed analysis by 10x Research points out that the drop below $55k was not entirely unexpected, as both the number of active Bitcoin addresses and market participation had been in steep decline since peaking in Q1 2024. In fact, Bitcoin addresses had fallen from their November 2023 high of 1.2 million to a mere 612,000 by March 2024. This sharp reduction suggests that retail and short-term holders have been offloading their BTC holdings, potentially leading to a significant market correction.

ETF Outflows Reflect Waning Institutional Confidence
Institutional investors appear to be following suit. Recent data shows that U.S. Bitcoin Exchange-Traded Funds (ETFs) saw net outflows exceeding $1 billion between August 27 and September 6. Some of the hardest-hit funds include Fidelity’s FBTC, which lost $450 million, and Grayscale’s GBTC, down $280 million. These outflows suggest that the broader market sentiment is turning more cautious, contributing to the recent price decline.
Despite these challenges, some traders see this correction as a necessary reset before Bitcoin embarks on its next upward trajectory. Notably, crypto trader Michaël van de Poppe speculates that Bitcoin could dip further to $53,000 before beginning a new two-year bull cycle.
Technical Indicators Echo 2021-2022 Bearish Trends
A closer look at Bitcoin’s technical charts shows similarities with the market behavior in late 2021, right before the 2022 bearish trend took hold. Bitcoin, which had dropped from its $50k support in January 2022, hit $36k by the end of the year. With BTC currently hovering just above $54,000, some analysts warn that if Bitcoin breaks below this critical level, we could see a sharp decline to $40,000 or lower.
Adding to the bearish narrative, the Mayer Multiple, which measures speculative activity in Bitcoin, currently reads 0.8—well below the bullish threshold of 1.0. This, coupled with Bitcoin’s failure to reclaim its 200-day moving average, points to further downside risk.
Can BTC Weather the Storm? Potential for a Market Turnaround
While the short-term outlook seems bleak, not all analysts are pessimistic. A report from CNF suggests a more optimistic scenario, where Bitcoin could reach $100,000 by the end of 2024, fueled by a broader market recovery. This bullish perspective is rooted in expectations of upcoming Federal Reserve interest rate cuts, which could flood the market with liquidity and boost investor appetite for riskier assets like Bitcoin.
In a similar vein, Cathie Wood of Ark Invest remains bullish, predicting that Bitcoin could skyrocket to $1.5 million by 2030. Wood argues that institutional adoption of Bitcoin is still in its early stages, and if institutional investors allocate just 5% of their portfolios to Bitcoin, the price could easily hit her ambitious target.
The Battle Between Bulls and Bears
Despite these long-term bullish forecasts, it’s clear that Bitcoin is currently navigating treacherous waters. ETF outflows, declining user engagement, and weak technical indicators are pulling the market in one direction, while optimistic predictions and potential Federal Reserve actions are pushing it in another.
Crypto analyst Jackis also weighed in, stating that Bitcoin is at a critical juncture where it could either break out into a long period of growth or enter another prolonged downturn. If BTC manages to hold its $54,000 support, it could set the stage for a new rally. However, a close below this level could signal the start of a new bear market.
Bitcoin’s Technical Picture: Support and Resistance Levels
From a technical perspective, Bitcoin has been rejected at $59,560—a key resistance level. If BTC fails to close above $56,000 soon, it could revisit the $49,900 support level. Indicators such as the Relative Strength Index (RSI) and Awesome Oscillator (AO) remain in bearish territory, suggesting weak momentum for any immediate price recovery.
However, if BTC can break above its immediate resistance at $56,022, it could rally as much as 6%, retesting the $59,560 level. Bulls will need to gather significant momentum to make this scenario a reality.
Conclusion: Is Bitcoin a Buy, Sell, or Hold?
Bitcoin’s current price action is indicative of a market in limbo, with both bullish and bearish forces at play. The significant outflows from ETFs and declining activity on the blockchain suggest that BTC could face more downward pressure in the near term. However, the potential for Federal Reserve interest rate cuts and long-term institutional interest may provide the catalyst needed for Bitcoin to stage a recovery.
For investors, the question remains: is this the right time to buy, or should they wait for further price drops? With Bitcoin holding precariously at the $54,000 support level, the next few weeks could provide clarity. A break below this level would confirm the bearish outlook, while a rebound could set the stage for a new bull run.
That's TradingNEWS
Read More
-
QQQ ETF Price Forecast - QQQ at $600.91: Nasdaq Growth Weighs Jobs Shock, High Yields and AI Productivity
12.02.2026 · TradingNEWS ArchiveStocks
-
XRPI And XRPR ETF Prices Lag At $7.74 And $11.44 While $1.23B XRP ETF Flows Test A Weak $1.38 Spot
12.02.2026 · TradingNEWS ArchiveCrypto
-
Gold Price Forecast: XAU/USD Guards $5,000 as Wall Street Maps Run Toward $6,100–$7,200
12.02.2026 · TradingNEWS ArchiveCommodities
-
EUR/USD Price Forecast: Can the Euro Clear 1.1900 as Dollar Momentum Fades Below 97?
12.02.2026 · TradingNEWS ArchiveForex


