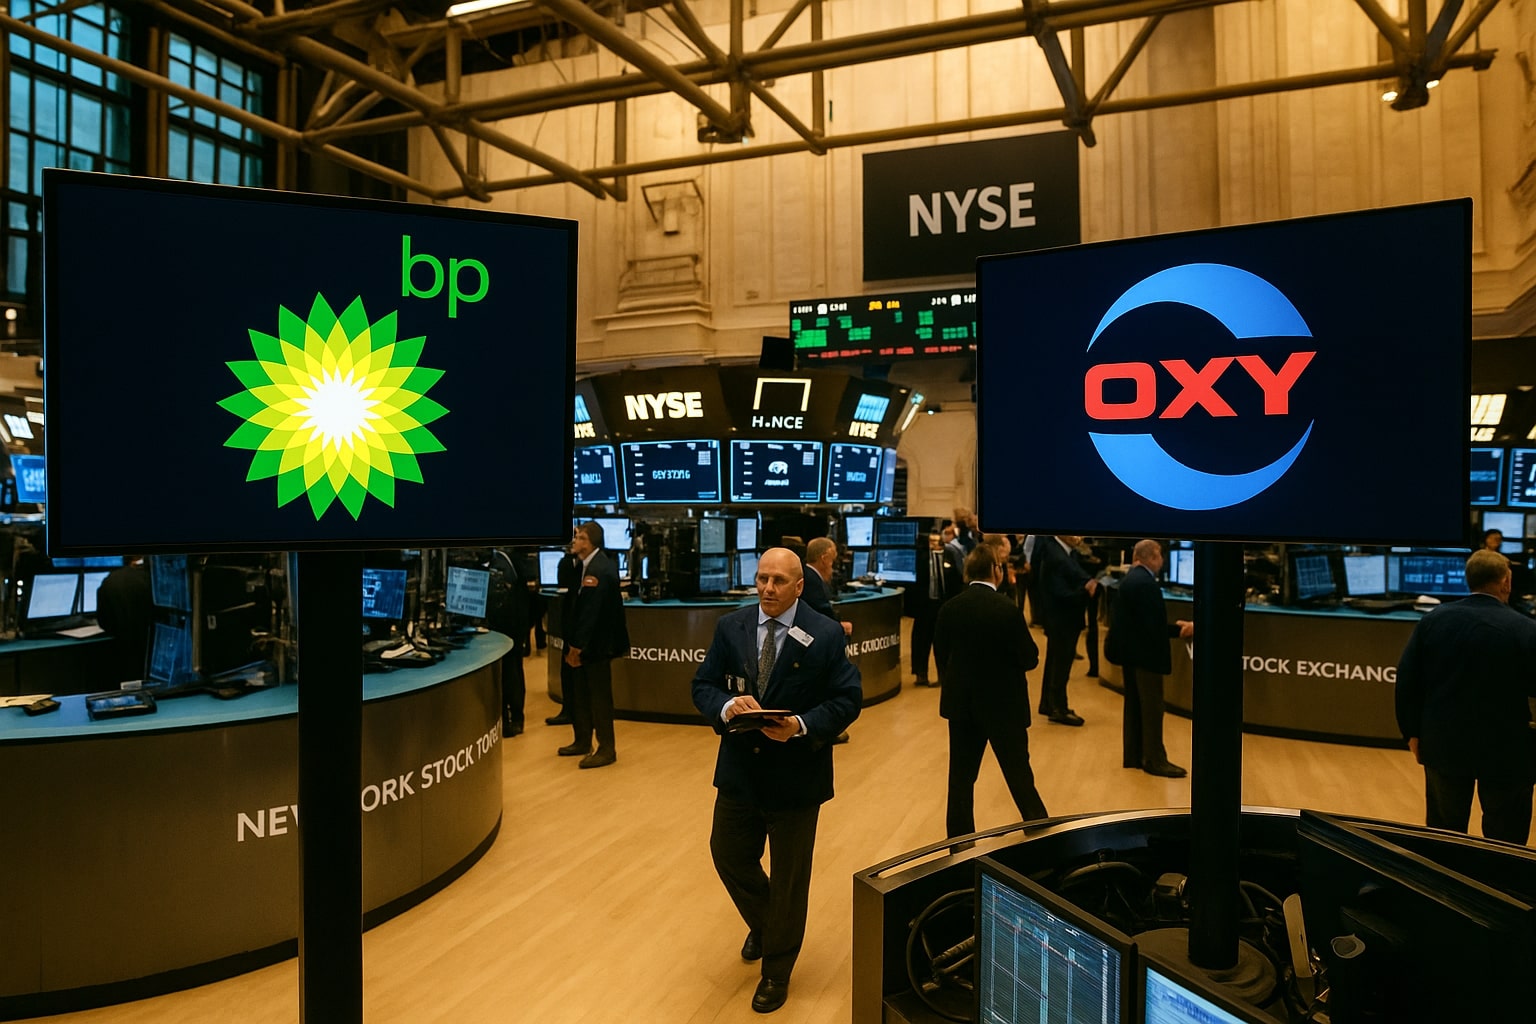
BP Stock vs Occidental Petroleum OXY Stock Analysis: Dividends, Carbon Capture, and 40% Upside
BP delivers scale and a 5.89% dividend, while OXY pushes debt reduction and Stratos carbon capture. Both stocks trade at discounts with 30–40% upside potential | That's TradingNEWS
NYSE:BP vs NYSE:OXY – Valuation, Profitability, and Market Positioning
BP p.l.c. (NYSE:BP) trades at $33.89 with a market cap of $88.8 billion, while Occidental Petroleum (NYSE:OXY) sits at $45.67 with a smaller capitalization of $44.9 billion. On forward valuation, BP carries a 12.4x P/E, while OXY trades at 17.0x forward earnings, reflecting a market willingness to pay a premium for Occidental’s faster debt reduction and stronger U.S. asset profile. On EV/EBITDA, BP is at 4.42x, cheaper than OXY’s 5.4x, suggesting the UK-based giant is more discounted despite its larger scale.
Dividend Yields and Shareholder Returns
BP currently pays an annual dividend of $2.00 per share, offering a forward yield of 5.89%, significantly higher than OXY’s 2.1% yield. Over the past decade, BP has returned $87.1 billion to shareholders via dividends and buybacks, nearly equal to its market capitalization. OXY, while not as aggressive on total payout history, is channeling cash toward balance sheet repair after reducing debt by $7.5 billion in the past 13 months, saving $410 million annually in interest costs. BP is more attractive for income-oriented investors seeking stable dividends, while OXY’s smaller yield is offset by deleveraging progress.
Revenue, Profit Margins, and Cash Flow Dynamics
BP delivered $46.62 billion revenue in Q2 2025, down 1.4% year-over-year, but net income jumped to $2.35 billion from just $90 million last year, pushing margins to 4.14%. Its operating cash flow stood at $6.2 billion in Q2, while free cash flow reached $9.3 billion TTM. OXY reported $27.15 billion revenue and $1.73 billion net income TTM, with a higher profit margin of 9% and free cash flow of $4.5 billion, highlighting better profitability relative to size. In terms of operational efficiency, OXY outperforms BP on margin, but BP generates substantially larger absolute cash flows due to its scale.
Strategic Direction: Traditional Oil vs Diversified Carbon Capture
BP has made a clear pivot back to hydrocarbons, cutting renewables to less than 5% of annual CapEx and launching 10 new discoveries across Brazil, Angola, Trinidad, and the Gulf of Mexico. Its AI-driven efficiency programs already reduced drilling times by 90% in Azerbaijan and cut annual costs by $1.7 billion, with a $4–5 billion savings target by 2027. In contrast, OXY remains focused on U.S. shale leadership, particularly in the Permian Basin, where well costs have fallen 13% in 2025. More importantly, OXY differentiates itself through the Stratos carbon capture facility, scheduled for 2025 launch with 500,000 tons annual capacity, backed by Microsoft, Amazon, and Airbus. BP is doubling down on oil, while OXY is hedging its future with a long-term diversification into carbon markets.
Balance Sheet and Leverage Profile
BP holds $74.9 billion in total debt, nearly equal to its cash position of $35.3 billion, with a 94% debt-to-equity ratio. Despite the heavy leverage, the group targets net debt of $14–18 billion by 2027, a steep decline from current levels. OXY carries $24 billion debt, far smaller in absolute terms, with debt-to-equity at 66.8%. Crucially, OXY is already ahead in deleveraging, having executed significant repayments that lowered financing costs. BP is larger and more diversified but slower in reducing leverage, while OXY presents a cleaner path to balance sheet strength in the near term.
Analyst Price Targets and Upside Potential
BP trades below analyst consensus of $37.25, with a bullish case for $49 by 2027, representing 40% upside. Its valuation gap with peers like Shell and ExxonMobil suggests mispricing. OXY carries a consensus price target of $50.65, with highs at $64, implying 30–40% potential upside. Some intrinsic value estimates place OXY closer to $88.85, suggesting even larger gains if energy prices recover. Both stocks trade at a discount, but OXY’s rerating case is tied to successful debt reduction and carbon capture execution, while BP’s rerating depends on oil demand resilience and efficiency-driven margin expansion.
Read More
-
MicroStrategy Stock Price Forecast: MSTR Jumps Back Above $130 on 713K BTC and $2.25B Cash
13.02.2026 · TradingNEWS ArchiveStocks
-
XRP Price Forecast: Can XRP-USD Defend $1.35 Support After a 30% Slide?
13.02.2026 · TradingNEWS ArchiveCrypto
-
Oil Price Forecast: Oil Slide as Surplus Fears Replace War Premium
13.02.2026 · TradingNEWS ArchiveCommodities
-
Stock Market Today: AI Fears Hit Nasdaq as S&P 500 and Dow Struggle While AMAT and Rivian Rip Higher
13.02.2026 · TradingNEWS ArchiveMarkets
-
GBP/USD Price Forecast - Pound Holds 1.36 as Softer US CPI Revives June Fed Cut Expectations
13.02.2026 · TradingNEWS ArchiveForex
Insider and Institutional Sentiment
Insider transactions at BP can be tracked here, showing a mixed but steady picture of confidence. Institutional ownership remains modest at 12.4%, reflecting skepticism tied to legacy Deepwater Horizon risks and European regulatory exposure. OXY, meanwhile, continues to benefit from Warren Buffett’s Berkshire Hathaway, which holds a large stake, adding credibility and long-term institutional backing. This creates stronger market confidence in OXY’s management discipline compared to BP’s historically slower strategic pivots.
Comparative Investment Case: NYSE:BP vs NYSE:OXY
At $33.89, BP offers stronger dividends, larger cash flows, and a discounted valuation, but carries heavier debt and regulatory overhangs. At $45.67, OXY delivers better profitability, faster debt reduction, and unique exposure to carbon capture markets, though with a smaller yield. For income-focused investors seeking reliable dividends above 5%, BP is the better choice. For growth-oriented investors seeking capital appreciation with optionality in carbon capture, OXY presents a more compelling story. Based on current numbers, BP leans Buy for income and value, while OXY is a Buy for growth and deleveraging upside, with both offering 30–40% potential appreciation depending on oil markets.


