Comprehensive Analysis - Is SPDR S&P 500 ETF Trust a Buy ?
Exploring SPY's Performance, Valuation Risks, and the Influence of Macroeconomic and Geopolitical Dynamics on Investment Strategy | That's TradingNEWS
In-Depth Analysis of SPDR S&P 500 ETF Trust (SPY): Market Dynamics and Valuation Insights
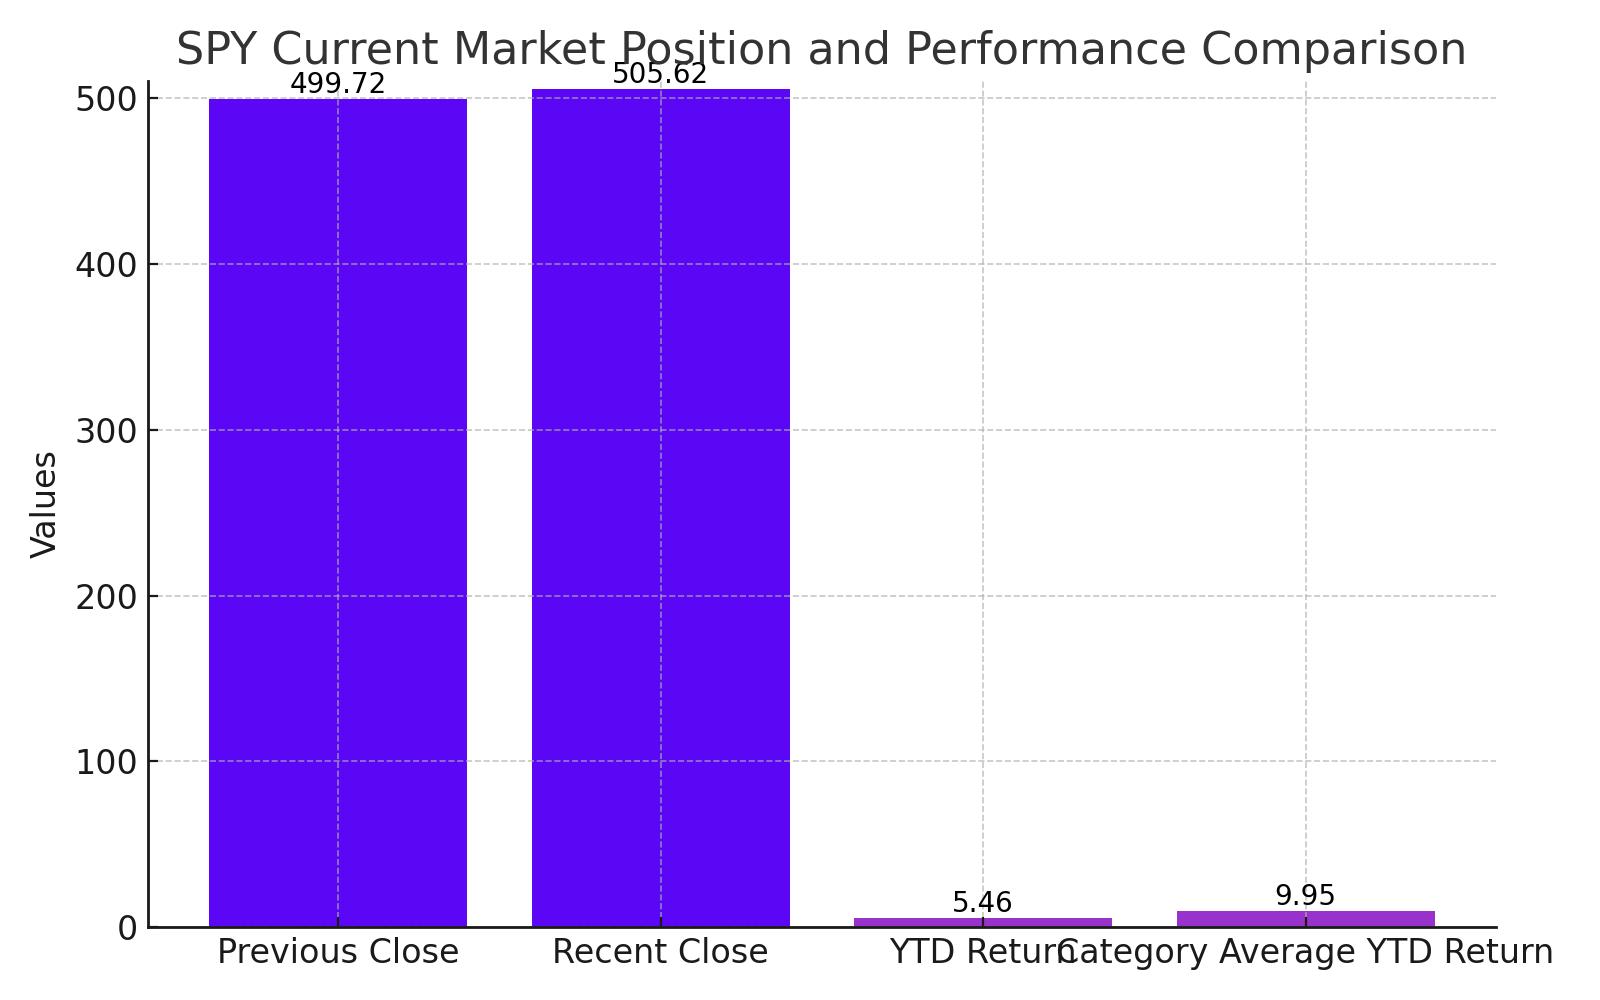
Current Market Position of SPY
The SPDR S&P 500 ETF Trust (NYSEARCA:SPY), representing a broad spectrum of the U.S. equities market, closed recently at $505.62, marking a modest increase from the previous close of $499.72. This ETF, which is designed to track the S&P 500, has shown a year-to-date (YTD) daily total return of 5.46%, underperforming its category average of 9.95%. This difference highlights a relative lag in capturing the upward market trends seen in other large blend categories.
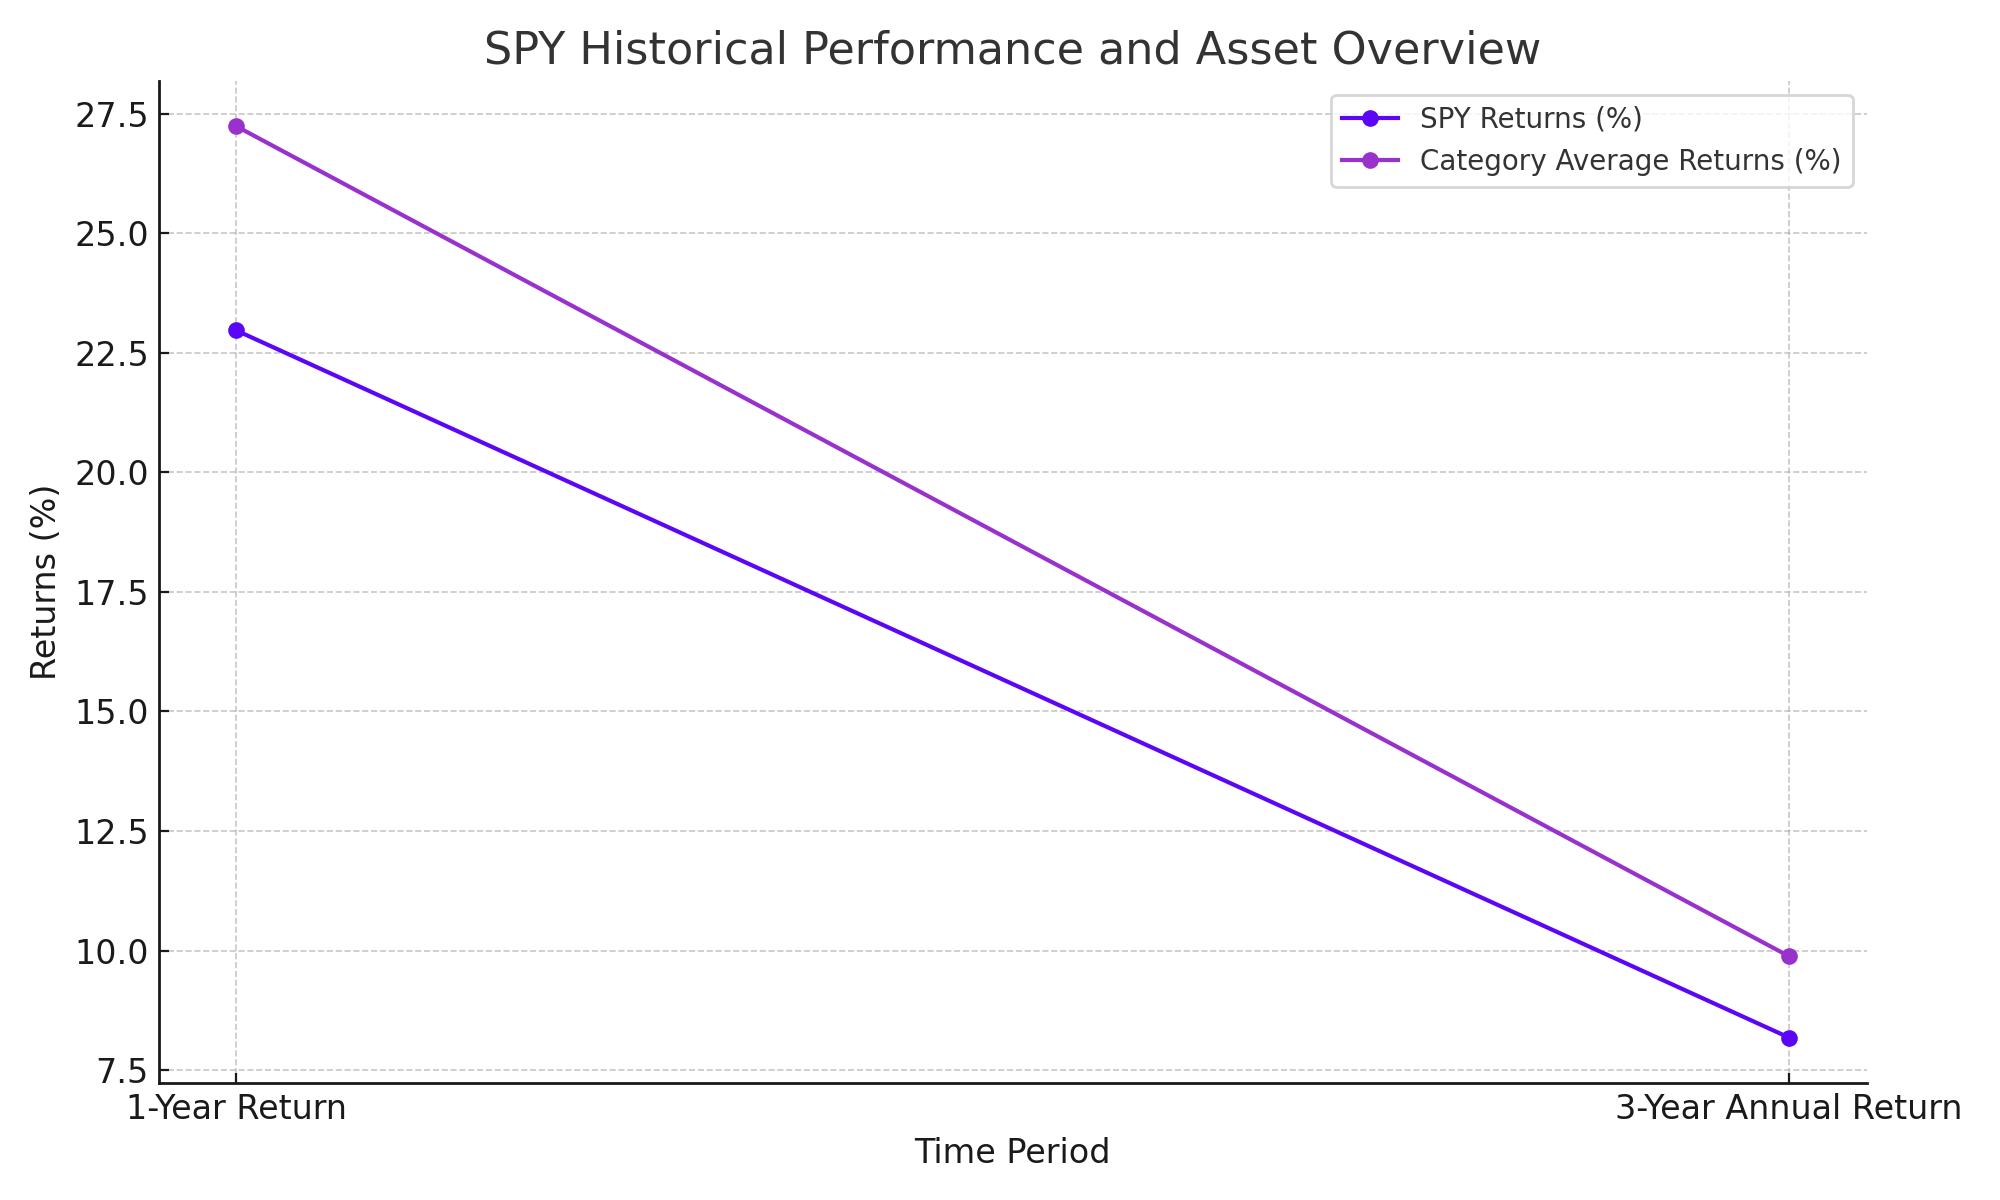
Historical Performance and Asset Overview
SPY's performance over the years offers a mixed picture. While the 1-year return stands at a robust 22.97%, outpacing the category's 27.24%, the 3-year annual return of 8.18% trails behind the category average of 9.88%. The ETF manages net assets worth $536.15 billion, making it one of the largest and most significant in its class. The ETF’s expense ratio at 0.09% remains competitively low, enhancing its appeal to cost-conscious investors.
Key Holdings and Sector Allocation
The ETF's portfolio is heavily weighted towards technology (30.58%), reflecting a significant exposure to major tech giants like Microsoft, Apple, and NVIDIA, which alone constitute over 17% of its assets. This concentration in high-tech sectors positions SPY to capitalize on the tech industry's growth but also exposes it to sector-specific downturns.
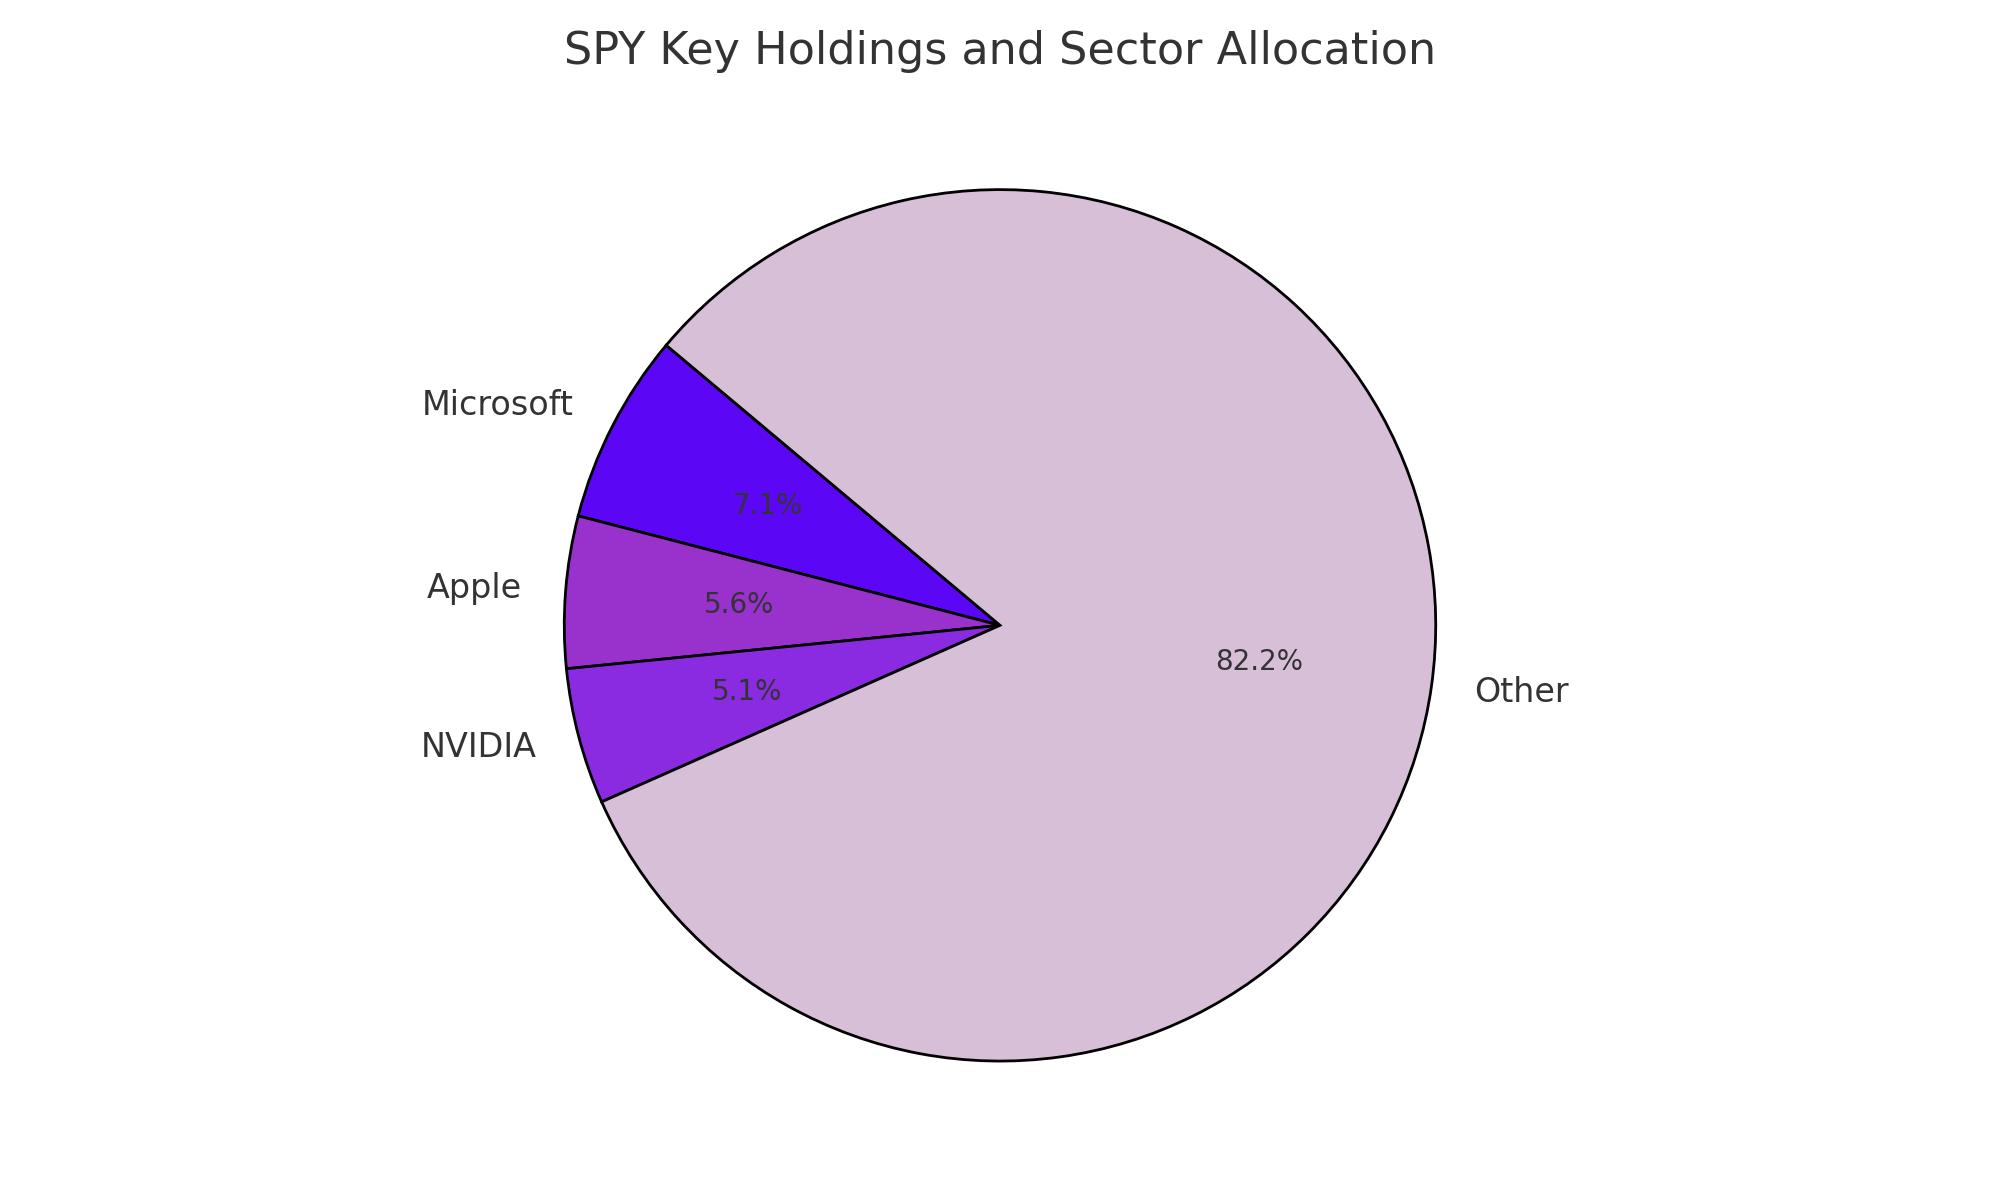
Portfolio Composition and Sector Exposure
SPY’s asset allocation is heavily tilted towards technology, with significant stakes in Microsoft (7.07%), Apple (5.63%), and NVIDIA (5.05%). While this sector focus aligns SPY with growth trajectories in tech, it also exposes the ETF to volatility inherent in the tech sector, particularly in periods of market correction.
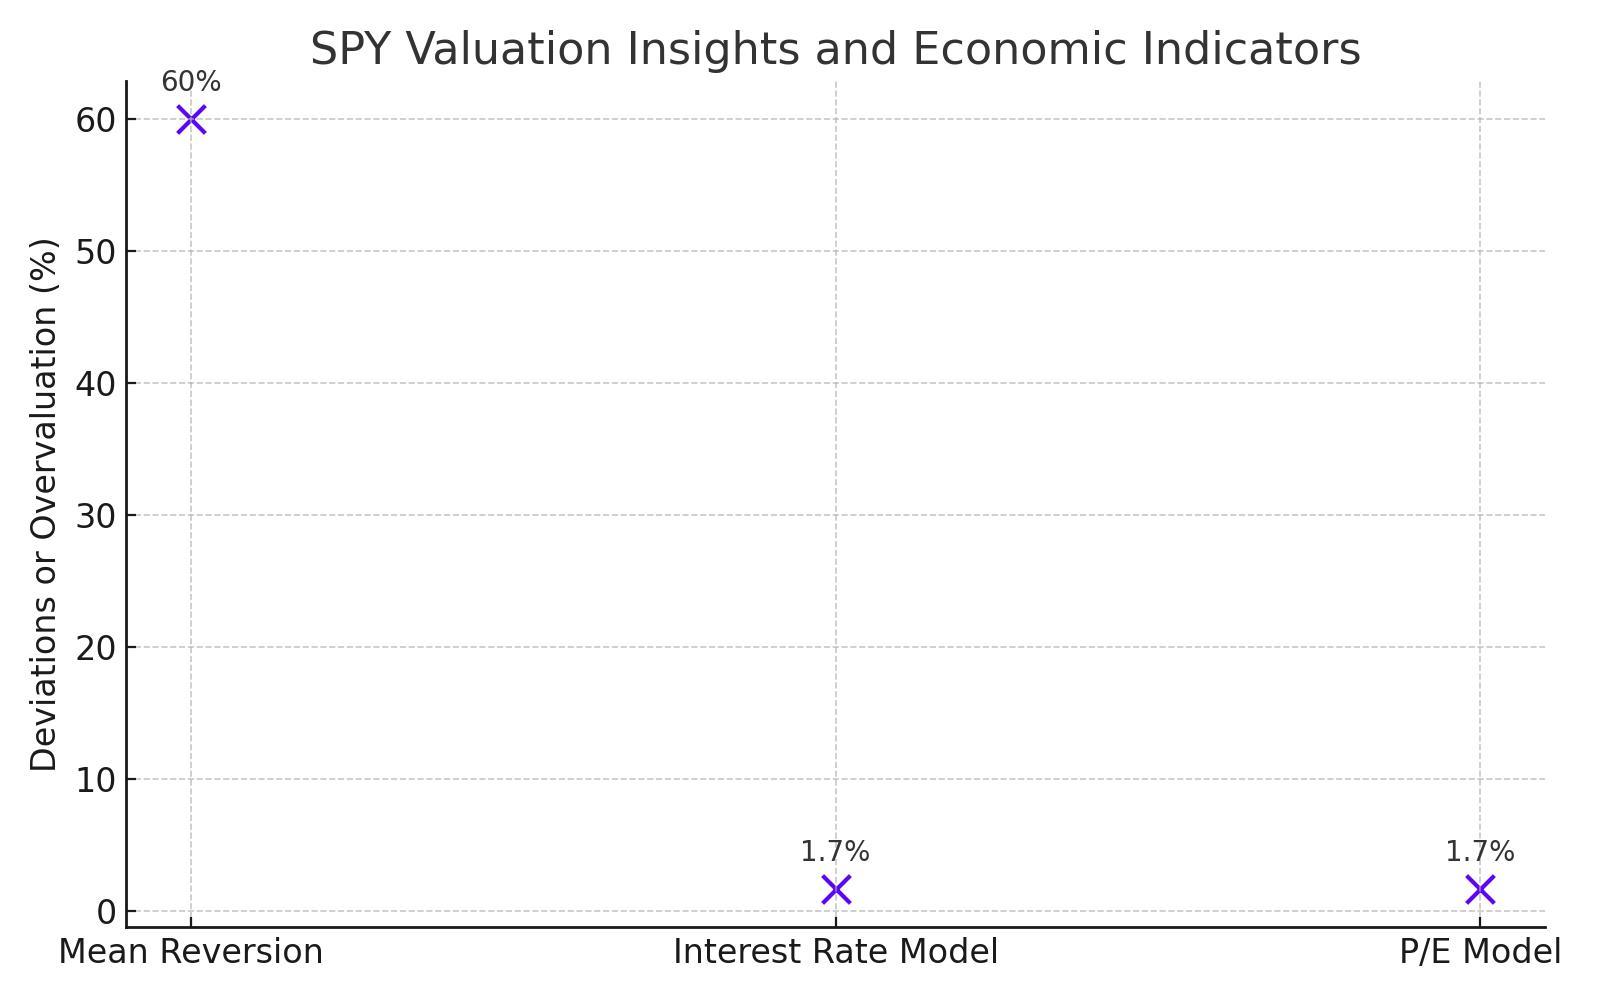
Valuation and Market Outlook
Current valuation models raise red flags about potential overvaluation:
- Mean Reversion Model: Indicates the S&P 500 is 60% above its historical trend, suggesting a significant overvaluation that might correct.
- Interest Rate and P/E Models: Both suggest that the S&P 500, and by extension SPY, are approximately 1.7 standard deviations above the norm, reinforcing concerns about sustainability of current price levels.
Read More
-
GPIQ ETF Price Forecast: Can a 10% Yield at $52 Survive the Next Nasdaq Selloff?
09.02.2026 · TradingNEWS ArchiveStocks
-
XRP ETF Price Forecast: XRPI at $8.32, XRPR at $11.86 as $44.95M Inflows Defy BTC and ETH Outflows
09.02.2026 · TradingNEWS ArchiveCrypto
-
Natural Gas Futures Price Forecast: Will The $3.00 Floor Hold After The $7 Winter Spike?
09.02.2026 · TradingNEWS ArchiveCommodities
-
Stock Market Today: Dow Back Under 50K While S&P 500 and Nasdaq Push Higher as Gold Reclaims $5,000
09.02.2026 · TradingNEWS ArchiveMarkets
-
USD/JPY Price Forecast: Can Bulls Clear 157.5 Without Triggering a 160 Intervention Line?
09.02.2026 · TradingNEWS ArchiveForex