GBP/USD: Bullish Structure Above 1.34 As Fed Easing Outpaces A Reluctant BoE
GBP/USD Price Action And Trading Range
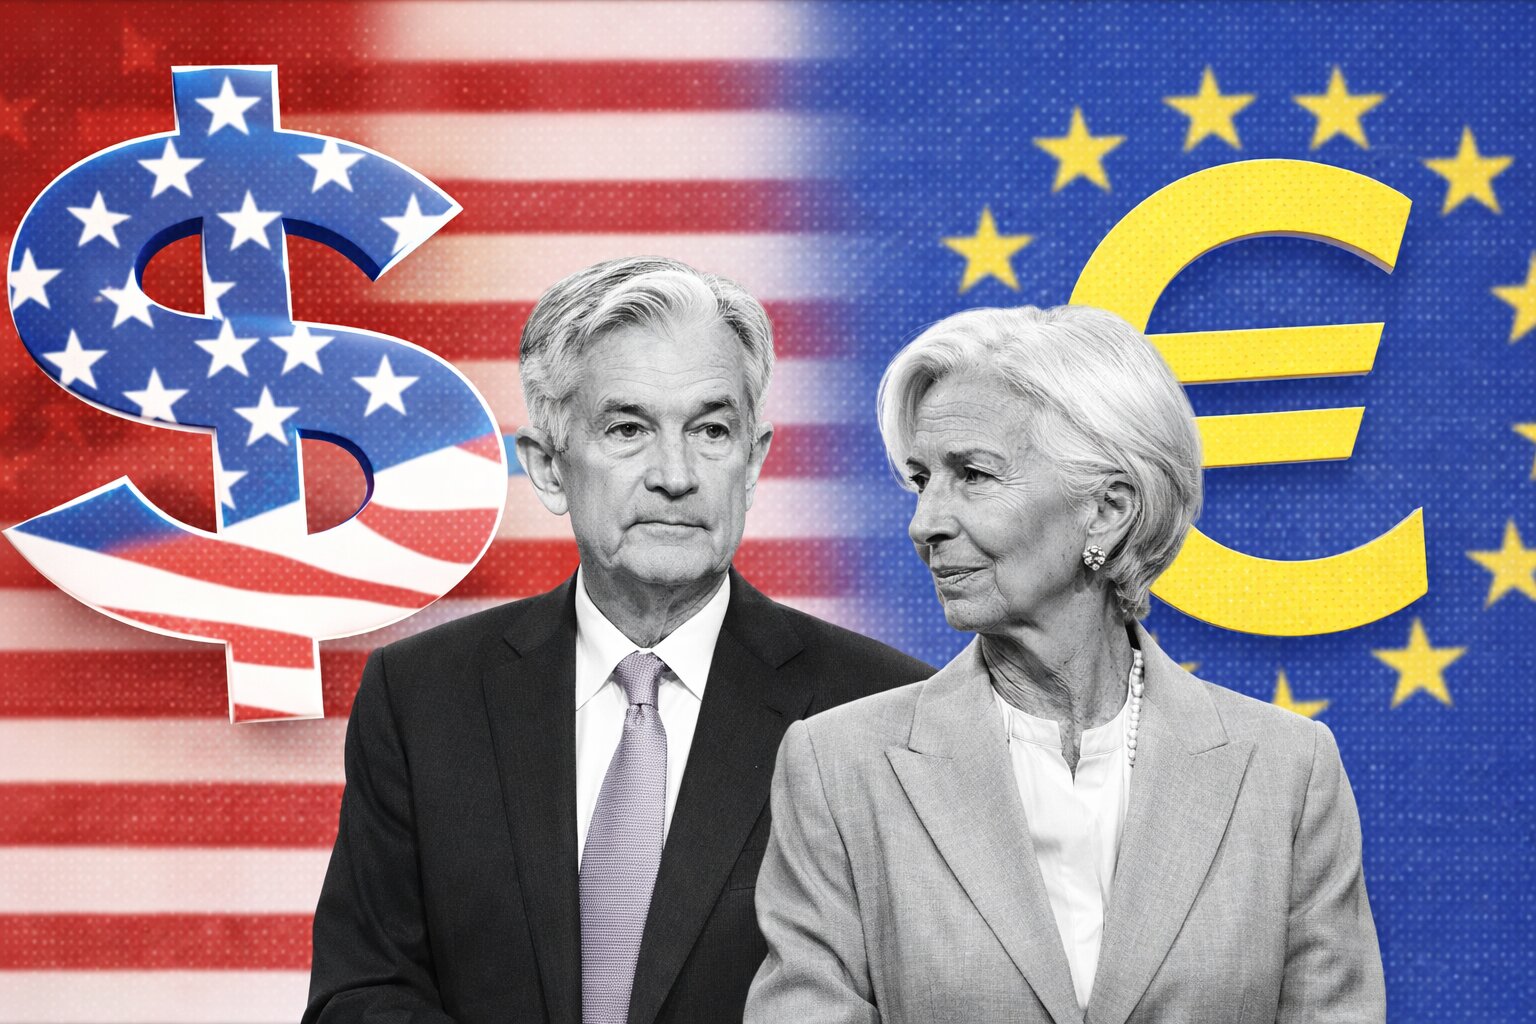
GBP/USD is trading in the 1.3470–1.3535 band after a two-day vertical move that pushed the pair to its strongest area since September. Spot is pivoting around 1.3500 after intraday highs near 1.3534–1.3535. The move is driven less by UK strength and more by the policy spread: a Bank of England easing only reluctantly from 3.75% while the Federal Reserve has already cut 75 bps and is priced for further easing into 2026, with the US Dollar Index stuck in the 97.70–98.10 zone.
Bank Of England: Reluctant Easing From 3.75% Supports GBP
The BoE’s latest 25 bp cut took Bank Rate to 3.75%, but the voting split was 5–4, with four MPC members refusing to cut at all. That is not a classic dovish pivot; it signals a central bank that still sees price pressures as too high. Headline UK inflation is 3.2% year-on-year, down from 3.8% but still 1.2 percentage points above the 2% target. Services inflation and wage growth remain sticky, and communication frames future moves as a “closer call,” which limits how quickly policy can be loosened.
UK Growth And Domestic Macro Backdrop For GBP/USD
UK macro data are weak but not catastrophic. Third-quarter GDP printed 0.1% quarter-on-quarter and 1.3% year-on-year, exactly in line with expectations. A revision took Q2 from 0.2% to 0.1%, but 2024 numbers were nudged higher, keeping the 1.3% YoY pace unchanged. BoE projections still assume activity comes close to stalling into late 2025 as tighter financial conditions and the latest Budget weigh on demand. That backdrop caps upside for GBP/USD based purely on domestic growth but does not justify aggressive emergency cuts.
UK External Position: Narrower Deficit But Persistent Vulnerability For GBP
The UK’s structural weakness remains its external balance. The current account deficit narrowed from about £21.2 billion in Q2 to £12.1 billion in Q3, which reduces tail risk but does not eliminate vulnerability. GBP still depends on foreign inflows to finance that gap. As long as global risk appetite is healthy, the narrowing deficit is a modest positive. If risk sentiment deteriorates sharply, however, the structural shortfall can quickly return to focus and trigger a fast repricing lower in GBP/USD even without a change in BoE policy.
US Dollar Side: DXY Bear Trend Under Fed Easing Expectations
On the USD leg, the bias is clearly negative. The US Dollar Index trades around 97.70–98.10 inside a descending channel, posting lower highs and lower lows. Sellers repeatedly defend the 98.50–98.70 band where the 50-EMA and a falling trend line intersect, while the 100-EMA near 99.10–99.20 adds an overhead cap. RSI sits around 40–45, confirming weak momentum rather than oversold stress. The core driver is expectations that the Fed will extend its easing cycle in 2026, even after 75 bps of cuts already delivered this year.
US Macro Mix: Strong Backward GDP, Softer Forward Indicators
Headline US growth is strong, but the details are less supportive for the dollar. Real Q3 GDP printed 4.3% annualised, beating the 3.3% consensus and improving on the prior 3.8%. At the same time, the GDP Price Index accelerated to 3.7% versus a 2.7% forecast, core PCE in Q3 rose to 2.9% from 2.6%, and headline PCE inflation moved to 2.8% from 2.1%. Those readings argue against panic cuts, but forward-looking indicators are softening: Durable Goods Orders dropped 2.2% in October after a 0.7% September gain, ex-defence orders slid 1.5%, core ex-transport orders rose only 0.2% versus 0.3% expected, industrial production fell 0.1% in October and rebounded just 0.2% in November, and Conference Board consumer confidence fell to 89.1 against a 91.0 forecast after a prior revision up to 92.9.
US Labour Data, Fed Path And Political Pressure On USD
Labour data are mixed. Initial jobless claims fell to 214,000 from 224,000, beating the 223,000 forecast, but continuing claims rose to 1.923 million from 1.885 million, and the four-week average of new claims eased only marginally from 217,500 to 216,750. The Fed has already cut rates by 75 bps, yet futures still price around 20% odds of another cut in January and roughly 50% odds of an additional move by March, with at least two 25 bp cuts being discussed for 2026. Political pressure is explicit: the US President has stated any future Fed chair should be ready to lower rates even with solid growth, raising concerns about central bank independence and reinforcing a structurally bearish skew for the dollar.
Safe-Haven Rotation: Gold Strength And The Impact On GBP/USD
Risk-hedging flows are diversifying away from the USD. Gold has surged toward the $4,500/oz area, with recent highs above $4,520 and pullbacks holding just below $4,500, while Bitcoin trades around $86,000–$87,000 after failing to break $90,000. When XAU/USD rallies like this and DXY remains trapped under the 98.50–99.20 EMA band, the dollar loses its status as the dominant safe haven. That backdrop favours high-beta and yield-supportive currencies and helps GBP/USD hold elevated levels even during occasional risk-off episodes.
GBP/USD Technical Structure: Rising Channel, Supports And Resistances
Technically, GBP/USD trades within a rising channel on the 4-hour chart that has guided the pair since late November. Price is oscillating around 1.3500–1.3515, above a dense support cluster between 1.3420 and 1.3455. The 50-EMA climbs through roughly 1.3425–1.3470 as dynamic support, and the prior breakout zone at 1.3455 has flipped into horizontal demand. Deeper structural support sits around 1.3390, marking the base of the recent impulsive leg and the lower channel boundary. On the topside, resistance comes in near 1.3545–1.3550 and then 1.3595–1.3600, with potential extension toward 1.3650 if DXY stays heavy. RSI on the 4-hour chart holds in the 60–70 band, signalling strong trend energy without an immediate blow-off top.
Liquidity, Positioning And Short-Term Risks For GBP/USD
Short-term risk is driven by liquidity and positioning rather than fundamentals. Into Christmas and New Year, volumes thin out, increasing the probability of false breaks around 1.35, with brief spikes through 1.3534–1.3535 followed by sharp reversals. Some of the recent upside reflects position clean-up: dollar longs being cut and underweight-GBP accounts chasing performance as the pair trades near 10–12-week highs. None of that invalidates the broader uptrend unless GBP/USD closes decisively below 1.3390 and then slides toward 1.3310 where the 200-EMA and prior congestion zone converge.
Rate Differentials, Risk Scenarios And Invalidation Levels
The relative policy story is central. With Bank Rate at 3.75% and the BoE expected to trim only toward roughly 3.25% via two additional 25 bp cuts, while the Fed has already eased 75 bps and is priced to do more, the old rate advantage that supported USD has eroded. A 5–4 BoE vote against deeper easing underlines that the UK central bank remains more hawkish than the Fed at the margin. Upside risks to USD would come from another run of 4.3%-type US GDP with core PCE pinned near 2.9% and confidence stabilising, which would allow the Fed to resist further cuts. In that scenario, GBP/USD likely stalls below 1.3600–1.3650 and could trade back into the 1.3350–1.3430 area. On the UK side, a renewed widening of the current account back toward or beyond £21.2 billion or a GDP disappointment below the 0.1% QoQ / 1.3% YoY range would re-expose GBP’s structural weaknesses, especially if coupled with a broader risk-off move that drives flows into USD cash and Treasuries.
Final Stance On GBP/USD: Buy, Sell Or Hold
With GBP/USD trading around 1.3500, recent highs at 1.3518, support at 1.3420–1.3455 and 1.3390, resistance in the 1.3545–1.3600–1.3650 band, Bank Rate at 3.75% on a 5–4 split, UK inflation at 3.2%, UK GDP at 0.1% QoQ and 1.3% YoY, the current account deficit narrowed to £12.1 billion, the Fed 75 bps into an easing cycle, DXY pinned near 97.7–98.0, US GDP at 4.3% with PCE near 2.8–2.9%, and GBP/USD locked in an orderly rising channel, the balance of evidence favours further upside rather than a reversal. The stance is bullish: GBP/USD is a Buy on dips into roughly 1.3430–1.3470 with upside focus on 1.3545 first, then 1.3595–1.3600 and potentially 1.3650 if dollar weakness persists. A daily close below about 1.3355, followed by a break under 1.3310, would invalidate this view and downgrade the pair from Buy to neutral; until that occurs, the path of least resistance for GBP/USD remains higher, not lower.
That's TradingNEWS