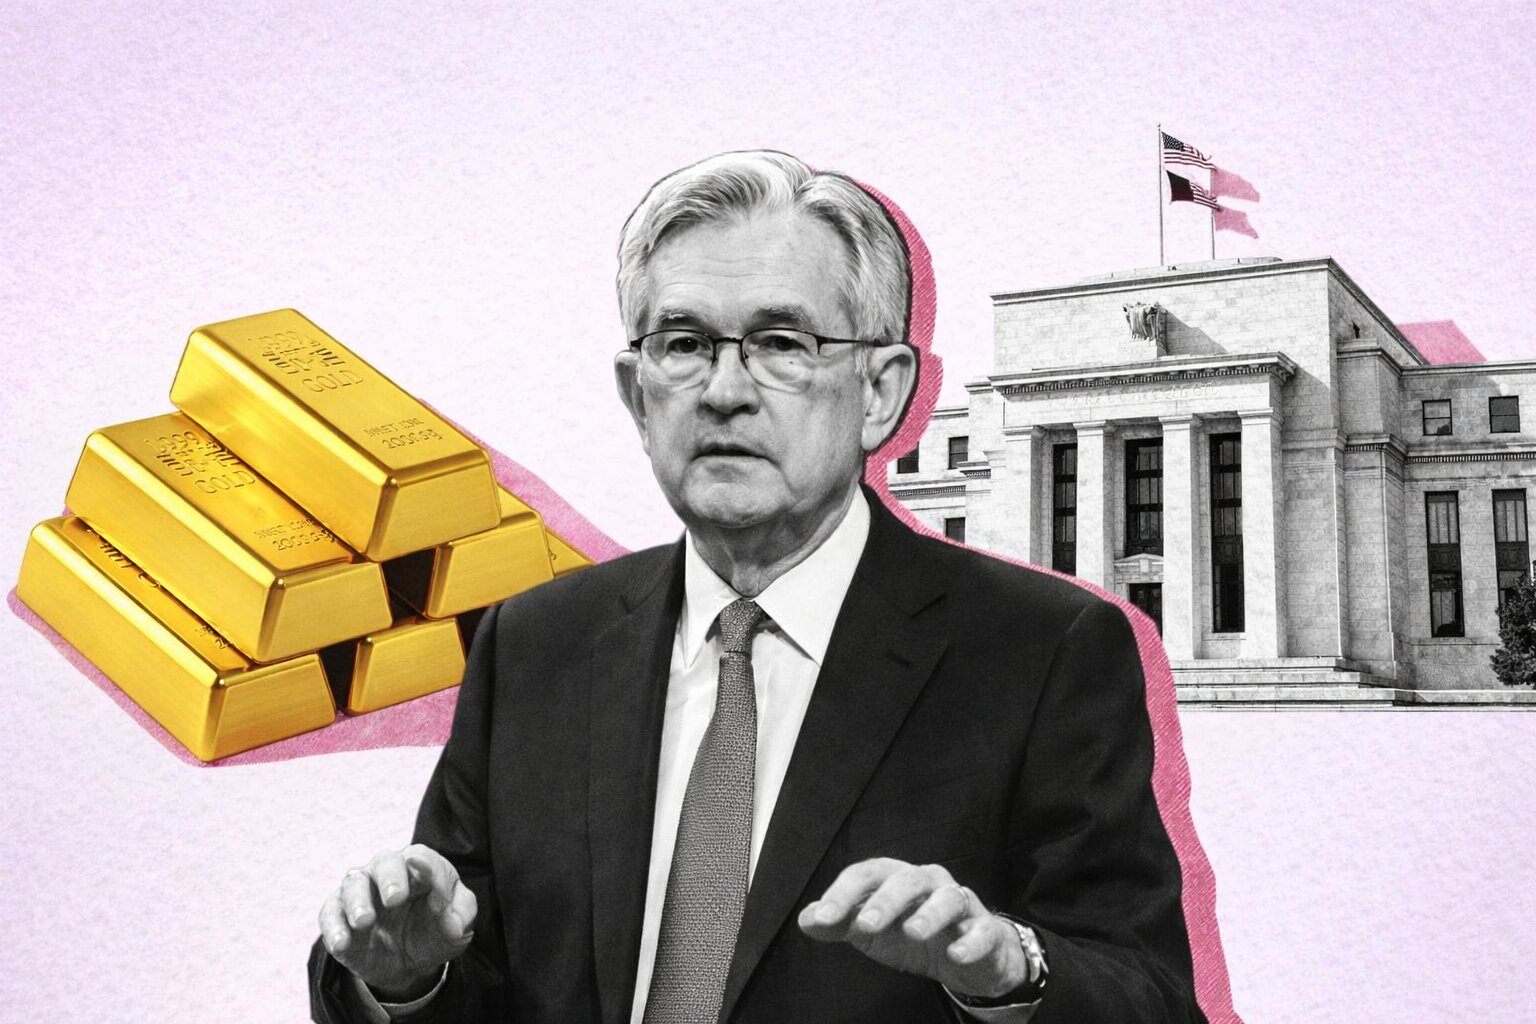
Gold Price Forecast 2026: XAU/USD Defends $5,000 and Eyes $6,000 Target
Gold surged 65% in 2025, hit a record $5,595 and then dived below $4,900; now XAU/USD is consolidating between $4,700 and $5,400 while markets weigh Fed cuts, dollar swings and central-bank buying on the path toward $6,000 | That's TradingNEWS
XAU/USD – gold holds the $5,000 battlefield after a 65% melt-up and the sharpest reset in decades
Gold or XAU/USD – from 65% 2025 rally to a $5,595 spike and violent $1,200 air-pocket
Gold’s latest cycle started long before the January shakeout. In 2025, XAU/USD climbed roughly 65%, powered by an unusual alignment: a global rate-cut narrative, heavy central-bank accumulation, a softer dollar and persistent geopolitical risk. Spot moved from the low $3,000s to an intraday high around $5,595 per ounce in late January 2026, trading more than $1,100 above the 52-week moving average near $3,439 – an elevation that rarely survives without a reset.
The reset arrived with maximum speed. After tagging $5,595, gold dropped more than 14% in a single day – the largest one-day loss on record – and almost $1,200 in two sessions. Positioning was extremely one-sided, with speculative long exposure stretched and systematic trend-followers heavily committed. The move flushed out leveraged longs but did not erase the structural backdrop that created the rally.
Macro drivers – why the 2026 gold story is messy but still structurally bullish for XAU/USD
The 2026 narrative is not a simple continuation of 2025’s vertical climb. The path of US rates, central-bank demand, dollar direction and geopolitics is now pulling in different directions. Rate-cut expectations slipped toward mid-year, but policymakers still acknowledge room for “several more” cuts if inflation resumes moving toward 2%. That leaves real yields capped and keeps a floor under XAU/USD, even if the pace of easing is slower than gold bulls wanted.
Central-bank buying remains a cornerstone but is shifting from emergency accumulation to sustained diversification. Official purchases around 863 tonnes in 2025 are projected to cool slightly to about 850 tonnes in 2026 – still historically high, but no longer accelerating. That removes some of the one-way impulse but maintains a structural bid.
On the currency side, the US dollar stopped sliding and started oscillating as hopes of aggressive easing collided with stubborn inflation data. Episodes of dollar strength – especially around rate expectations or political shocks – have produced brief but aggressive downdrafts in XAU/USD, as seen when the Warsh nomination temporarily strengthened the policy-credibility story around the greenback.
Geopolitically, the market shifted from headline-driven panic to a chronic-risk regime. Iran tensions, Eastern Europe flashpoints and broader institutional uncertainty still justify a safe-haven allocation, but the marginal bid is weaker than during the peak of the 2025 risk cycle. The result is a market where support is structural, but upside needs new catalysts instead of simply relying on fear.
Forecast spectrum – from $4,700–$6,500 consolidation to tail scenarios above $8,000 for gold
Price projections for XAU/USD in 2026 are unusually wide, reflecting how far the metal already ran. One conservative cluster of forecasts sees gold spending most of the year between roughly $4,700 and $6,500. In that scenario, the January spike to $5,595 is treated as an overshoot and the base case is a broad consolidation band that allows the market to absorb 2025’s 65% gain.
A different camp pushes explicit upside targets. One long-horizon model projects summer levels near $6,780 and potential year-end prices approaching $8,491, assuming elevated inflation pressure, ongoing geopolitical stress and no meaningful reversal in central-bank diversification. Another framework, even more aggressive, sketches a path where XAU/USD oscillates between roughly $5,184 and $9,999 in the first three quarters and finishes 2026 around $11,683 under extreme stress and sustained dollar erosion.
Institutional houses cluster closer to the middle. A large cross-section of bank desks now marks an annual median near $4,700–$4,800 per ounce, with quarter-average profiles around $5,000 and peak projections in the $5,400–$5,700 range. Some assign optionality for $6,000 in late 2026 if central-bank purchases stay near 800 tonnes and real yields grind lower. A fringe outlier scenario points to $8,700–$9,000, but that path requires a decisive breakdown in monetary credibility or a severe geopolitical shock.
The key point: consensus no longer expects another 65% year like 2025, but it also does not price in a bear market. The central range for XAU/USD is now a high plateau rather than a brief spike.
ETF flows, futures positioning and why gold is not Bitcoin – different risk, different holders
The flow picture behind XAU/USD has changed dramatically in the last two years. Gold ETFs saw inflows of roughly 801 tonnes in 2025, the second-largest annual inflow on record, pushing assets under management to about $350 billion. Even after the January crash, those vehicles continue to hold enormous inventories, with outflows modest compared with the earlier inflow wave.
The composition of ETF and futures holders matters. A larger share of positions now belongs to institutions that are not simply trend-chasing: reserve managers, wealth platforms and asset-allocation frameworks that treat gold as a portfolio ballast rather than a short-term punt. That profile is very different from the leveraged, derivatives-driven structure seen in segments of the Bitcoin market, where the derivatives complex can be ten times the spot and forced liquidations routinely drive cascades.
Where crypto has seen drawdowns near 50% from peaks, gold’s drawdown from $5,595 toward the $4,800–$4,900 pocket sits closer to 14–16%, even in the most violent phase. ETFs tied to Bitcoin now carry significant mark-to-market losses from late-2024 entries, while gold ETFs remain anchored near all-time highs in value terms. That relative resilience is exactly what long-horizon capital is paying for.
Short-term tape – XAU/USD pinned between $4,700 support and $5,100 resistance ahead of Fed events
Day-to-day, XAU/USD is trading like a macro options market around the $5,000 handle. In recent sessions spot has oscillated between roughly $4,854 and $4,959, with rebounds from the $4,841–$4,900 zone and repeated hesitation around $4,950–$5,015. Futures prices in the $4,950–$5,015 band, combined with spot in the high $4,800s to low $4,900s, define a short-term equilibrium where neither bulls nor bears have control.
The US Dollar Index hovering around the 97.2 region is capping clean upside trends. Rate-sensitive releases – especially the Fed’s January minutes and the PCE inflation print on 28 February – are the immediate triggers that can knock XAU/USD out of this micro-range.
The intraday profile confirms a positioning market: fast selling on headlines is met by buying interest near $4,850–$4,900, while attempts to run stops above $4,950–$5,000 face supply from those locking in profits after the January shock. Volatility metrics show daily swings of $100–$200 have become routine, even as average true range calculations drift lower from the peak stress days, signalling a market that is cooling but still far from calm.
Technical structure – XAU/USD is extended but the bull trend is intact above $4,000–$4,200
From a medium-term chart perspective, XAU/USD remains in a clear uptrend despite the January collapse. The 52-week moving average around $3,439 underscores how far price has travelled; trading more than $1,500 above that line is unsustainable indefinitely, but does not automatically imply a structural top.
On the weekly and daily charts, several levels now matter more than the headlines:
The $4,550–$4,580 belt acts as the primary lower support, aligning with late-December highs that have already been retested after the correction. As long as gold holds above this band on a weekly closing basis, the breakout structure remains valid.
Below that, $4,381 – an earlier resistance zone – is the first deeper retracement target and a textbook candidate to turn into support. A failure there would put $4,218 in focus, corresponding roughly to a 50% retrace of the last vertical leg higher.
On the topside, a resistance corridor between about $5,420 and $5,455 caps the prior closing highs before the intraday spike to $5,595. That zone is now the ceiling the market must clear to reopen a drive toward fresh records.
Shorter-term moving averages are acting as intraday decision points. A 20-day simple average near $4,906, a 50-day line around $4,934 and a 100-day average near $4,967–$4,983 collectively form a heavy resistance pocket above spot. Each attempt to trade through that band faces supply from trapped late-longs and systematic profit-taking. A decisive daily close above the $4,967–$4,983 region would be the clearest signal that the rebound is evolving into a trend resumption.
Deeper down, an exponential moving average cluster in the $4,700 area marks the “pain line” for late-cycle buyers. A weekly close below $4,550 followed by a slide toward $4,000, where the 200-day average converges with the November 2025 lows, would be the first credible sign that the multiyear bull run in XAU/USD is stalling.
Read More
-
AMLP ETF Price Forecast: 8% Yield As Alerian Midstream Giant Trades Just Below Record Highs
18.02.2026 · TradingNEWS ArchiveStocks
-
XRP ETFs Reset: XRPI, XRPR and XRPZ Track a Tense $1.50 Resistance Test
18.02.2026 · TradingNEWS ArchiveCrypto
-
Natural Gas Price Holds $3 – But Winter Spike Unwinds and LNG Politics Bite
18.02.2026 · TradingNEWS ArchiveCommodities
-
USD/JPY Price Forecast: 153–155 Range Tested as Policy Risks Build
18.02.2026 · TradingNEWS ArchiveForex
Sentiment, volatility and the emotional cycle behind the gold price
Sentiment indicators have swung hard. During the vertical move to $5,595, positioning was crowded and narratives were one-sided. After the January crash, measures of market mood shifted toward extreme fear and frustration, with language around “bubble,” “blow-off” and “unsustainable” dominating public commentary.
That emotional reversal rarely aligns with fundamental deterioration. Central banks still accumulate metal at an annual pace near 850–860 tonnes. ETF holdings remain elevated. Real policy rates, even if temporarily firm, are unlikely to revisit the pre-pandemic regime. Geopolitical tension has not vanished.
The combination of pessimistic short-term sentiment and intact long-term drivers is exactly the backdrop that produces broad trading ranges rather than clean tops or bottoms. For XAU/USD, that likely means extended time cycling between $4,700 and somewhere in the $5,400–$5,700 band while the market digests prior gains and waits for the next macro catalyst.
Relative value – gold versus other assets in a 2026 macro cross-current
On a cross-asset scoreboard, gold has already done the heavy lifting. A roughly 65% advance in 2025 outperformed most major equity indices and many commodity complexes. That outperformance allows XAU/USD to pause or consolidate without losing its strategic role.
Equities are debating the trade-off between slower growth and extended AI-driven multiples. Long-duration bonds remain hostage to inflation noise and fiscal questions. Crypto assets face their own adjustment, with Bitcoin giving back close to 40–50% from its highs and ETF flows turning negative even as nominal holdings remain large.
In that context, XAU/USD trading in a wide high-priced band is still attractive as a portfolio stabiliser. The metal no longer needs a straight-line rally to justify its allocation; it only needs to avoid a structural breakdown below the $4,000–$4,200 area while other risk assets face their own volatility regimes.
2026 base case for XAU/USD – range-bound, volatile, but still tilted upward rather than broken
Taking the macro drivers, forecast spectrum, flows and technicals together, the most realistic 2026 profile for XAU/USD is a high, volatile range with a mild upside tilt.
The working corridor is roughly $4,700–$6,500, with the lower half of that band – $4,700–$5,100 – already active as the current trading zone. Moves toward $4,550 or into the $4,381–$4,218 area would represent deeper corrections but not yet a structural collapse, as long as the 52-week trend and the $4,000 cluster hold.
On the topside, sequences toward $5,400–$5,700 are plausible once the market can clear the moving-average pocket around $4,900–$4,980 and reclaim $5,000 on a closing basis. Tail scenarios that test $6,000 or even $7,000+ require either a renewed dollar slide, a more aggressive Fed easing cycle, or an escalation in geopolitical and institutional stress that is not visible today but cannot be ruled out.
From a directional standpoint, the structure is moderately bullish rather than euphoric. At current levels around $4,900–$5,000, gold is not cheap in absolute terms, but the macro mix still favours holding exposure rather than abandoning it. For those already positioned, the data supports a bullish, “buy-and-manage-the-range” stance on XAU/USD, with risk anchored around the $4,000–$4,200 structural line and tactical trades framed by the $4,700–$5,400 band.