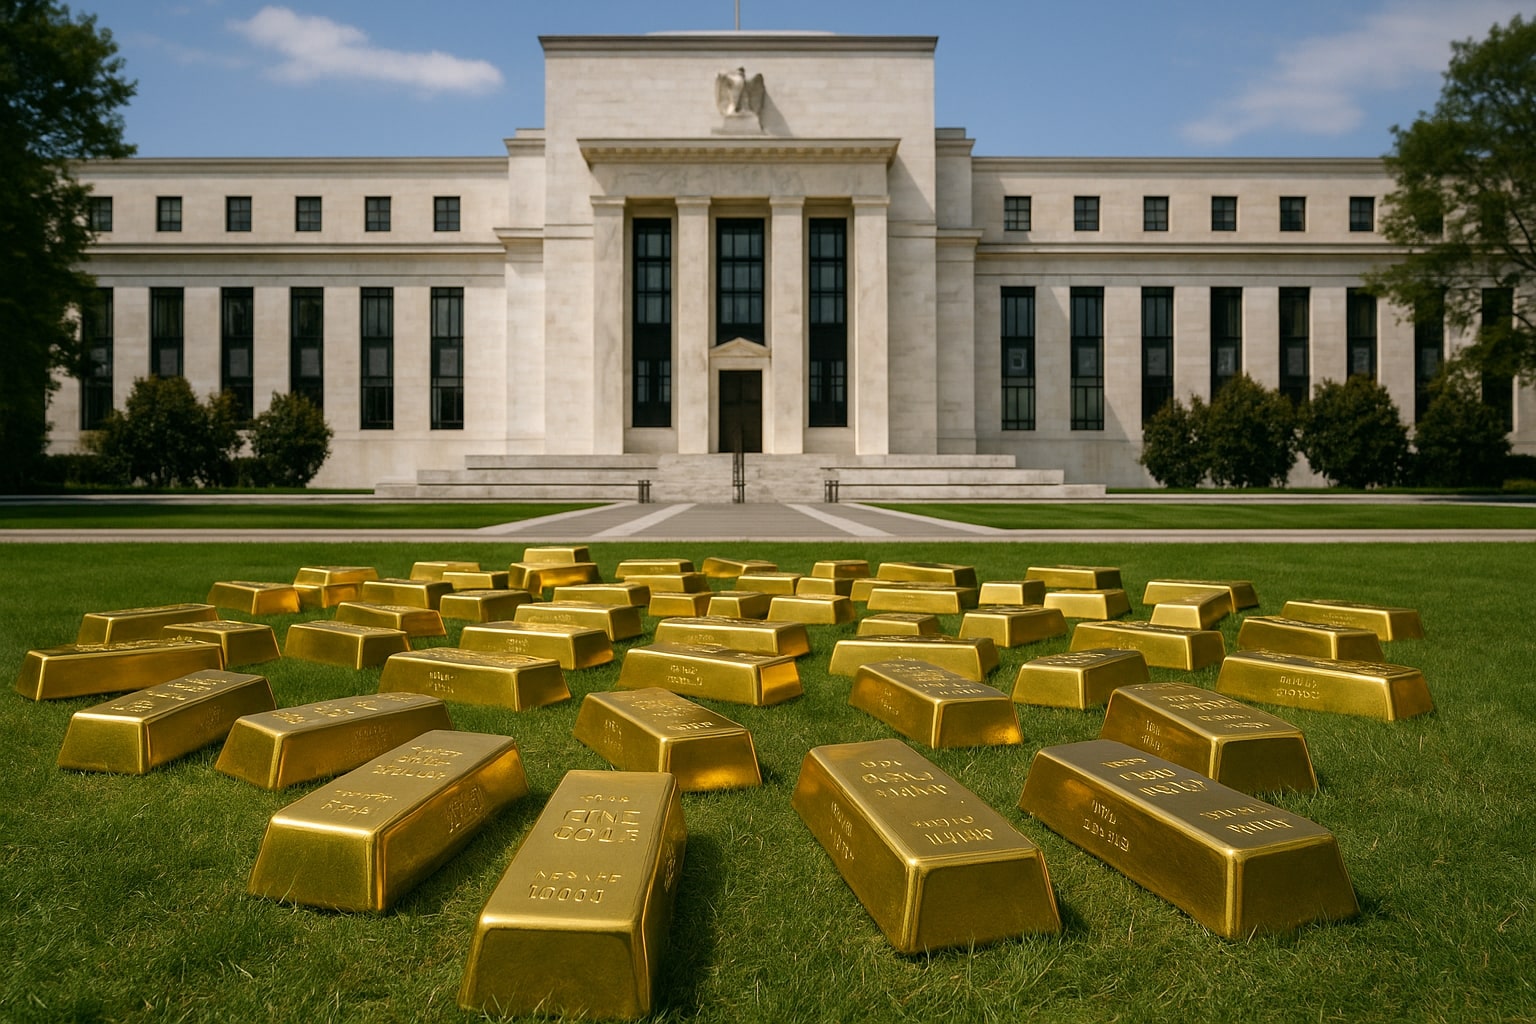
Gold Price Stalls Below $3,330 as Traders Await Fed Clarity, Eye Breakout Toward $3,800
XAU/USD Bulls Defend $3,300 Support Amid Dollar Strength, Trump-Powell Tension, and Global Central Bank Buying | That's TradingNEWS
Gold Price Holds Above Key Floor at $3,300 Despite Dollar Rally
Gold (XAU/USD) is showing notable resilience near the $3,317 level, stabilizing after a 0.48% pullback on July 17. While the current consolidation may seem subdued, gold remains up a powerful 26.29% year over year, outperforming most commodities and even rivaling broader stock market benchmarks like the S&P 500. The recent dip from $3,333 to $3,317 per ounce is largely attributed to renewed strength in the U.S. dollar and stronger-than-expected U.S. retail data, which reduced urgency for near-term Fed rate cuts. Yet, gold continues to hold a bullish posture as long as it trades above the psychological $3,300 mark and doesn’t breach the deeper $3,292 Fibonacci retracement level.
Fed Policy Uncertainty, Trump Comments Add Fuel to Gold Volatility
Markets were briefly rattled midweek by rumors that President Trump might fire Fed Chairman Jerome Powell, causing a short-lived surge in gold to $3,377 before reversing after Trump denied the move. These political shocks, coupled with sticky inflation as evidenced by June’s 2.9% YoY rise in core CPI, are reinforcing gold’s role as a macro hedge. Despite the PPI showing no monthly gain, inflation expectations remain elevated, prompting traders to price in a 52.4% chance of a rate cut in September, per CME FedWatch. The Fed’s hawkish tone from June FOMC minutes continues to limit upside in XAU/USD for now, but any dovish pivot or surprise weakness in U.S. data could spark a breakout above $3,360 and toward the $3,400 ceiling.
Technical Landscape: Bulls Eye $3,400 While Consolidation Holds
Technically, gold is trapped inside a symmetrical triangle with support at $3,300 and resistance at $3,360–$3,372. A confirmed breakout above the 23.6% Fibonacci level at $3,372 opens the door to retest the 2025 highs and eventually approach Goldman Sachs’ long-term call of $3,700. RSI sits at 48, indicating a neutral zone, while MACD remains flat—reflecting indecision and lack of strong momentum from either bulls or bears. First key resistance is at $3,358 and then $3,389, with support at $3,326 and $3,300. A breakdown under $3,292 may trigger deeper correction toward $3,228 and possibly $3,200.
Central Bank Demand and Physical Flows Still Supportive
Central bank gold purchases continue to play a critical role in underpinning demand. With U.S. 10-year Treasury yields steady at 4.459%, gold’s appeal as a non-yielding asset would typically diminish, yet the diversification play remains dominant, especially among emerging market central banks. Demand for physical bars and ETFs remains high, even as spreads tighten slightly—indicating improved liquidity and heightened investor interest. Notably, ETFs tracking gold remain stable in flows despite the recent dip, with institutional interest concentrated in inflation-hedging assets amid fiscal uncertainty.
Retail Sales, Tariffs, and Global Trade: Gold’s Macro Balance Sheet
U.S. retail sales for June beat expectations at +0.6%, suggesting resilient consumer demand and potentially delaying rate cuts. At the same time, geopolitical tailwinds remain active: the lifting of the AI chip ban with China, a new trade deal with Indonesia, and Trump’s proposal of 25% tariffs on Japanese imports all inject volatility and safe-haven demand. Ongoing trade talks with the EU and speculation about tariffs on Indian imports further highlight how gold remains tightly tethered to international trade rhetoric. Gold's dual role as both inflation hedge and geopolitical stabilizer continues to be tested with every shift in global trade and Fed expectations.
Historical Trend and Market Positioning Suggest Accumulation Phase
Despite underperforming stocks in high-growth periods, gold remains a critical long-term hedge. The metal’s gain of 35.7% over the past 12 months—from $2,472 to current $3,336 futures pricing—validates its position in institutional portfolios. The $3,200–$3,500 macro range remains intact, with most short-term positioning now centered on breakout trades. Should gold close above $3,400, algorithms and CTA funds may trigger fresh inflows targeting $3,700–$3,800 measured move, based on symmetrical triangle breakout structure. Until then, traders are cautiously watching consolidation near the 50-day EMA and 20-day SMA, which intersect near $3,323 and $3,331 respectively.
Verdict: Buy on Dips Remains Valid As Long as $3,292 Holds
Given the underlying momentum, central bank demand, tariff-induced uncertainty, and resilient long-term trend, gold (XAU/USD) remains in a bullish accumulation zone. Any correction toward $3,300–$3,292 remains a tactical buying opportunity, with upside capped at $3,360–$3,400 short term and $3,700+ medium term. If gold breaks below $3,292 and breaches $3,250 support, the bullish setup may unwind temporarily. Until then, the technical bias favors continued accumulation. Verdict: Buy Dips, Target $3,400, $3,700, and $3,800. Watch $3,292 for Stop Level.
That's TradingNEWS
Read More
-
Broadcom Stock Price Forecast: AVGO at $325 Ahead of AI-Driven Earnings
14.02.2026 · TradingNEWS ArchiveStocks
-
XRP Price Forecast: Ripple XRP-USD Climbs Back to $1.47 but $1.80 Wall and Sub-$1 Risk Still Dominate
14.02.2026 · TradingNEWS ArchiveCrypto
-
Natural Gas Futures Price Holds Around $3.20 as Storage Tightens and Winter Premium Fades
14.02.2026 · TradingNEWS ArchiveCommodities
-
Stock Market Weekly Recap: S&P 500 Stalls, Nasdaq Leads the Decline, Dow Eases as AMZN, NVDA, AAPL Sell Off
14.02.2026 · TradingNEWS ArchiveMarkets
-
GBP/USD Price Forecast - Pound Stuck at 1.36 as Fed Cut Hopes Clash With UK Weakness
14.02.2026 · TradingNEWS ArchiveForex


