Morgan Stanley MS Stock vs Goldman Sachs GS Stock: $156 vs $780, Yields and Earnings Power
MS leads in dividend yield and ROE, while GS posts stronger earnings growth, higher margins, and cheaper valuation. Both surged over 65% in the past year | That's TradingNEWS
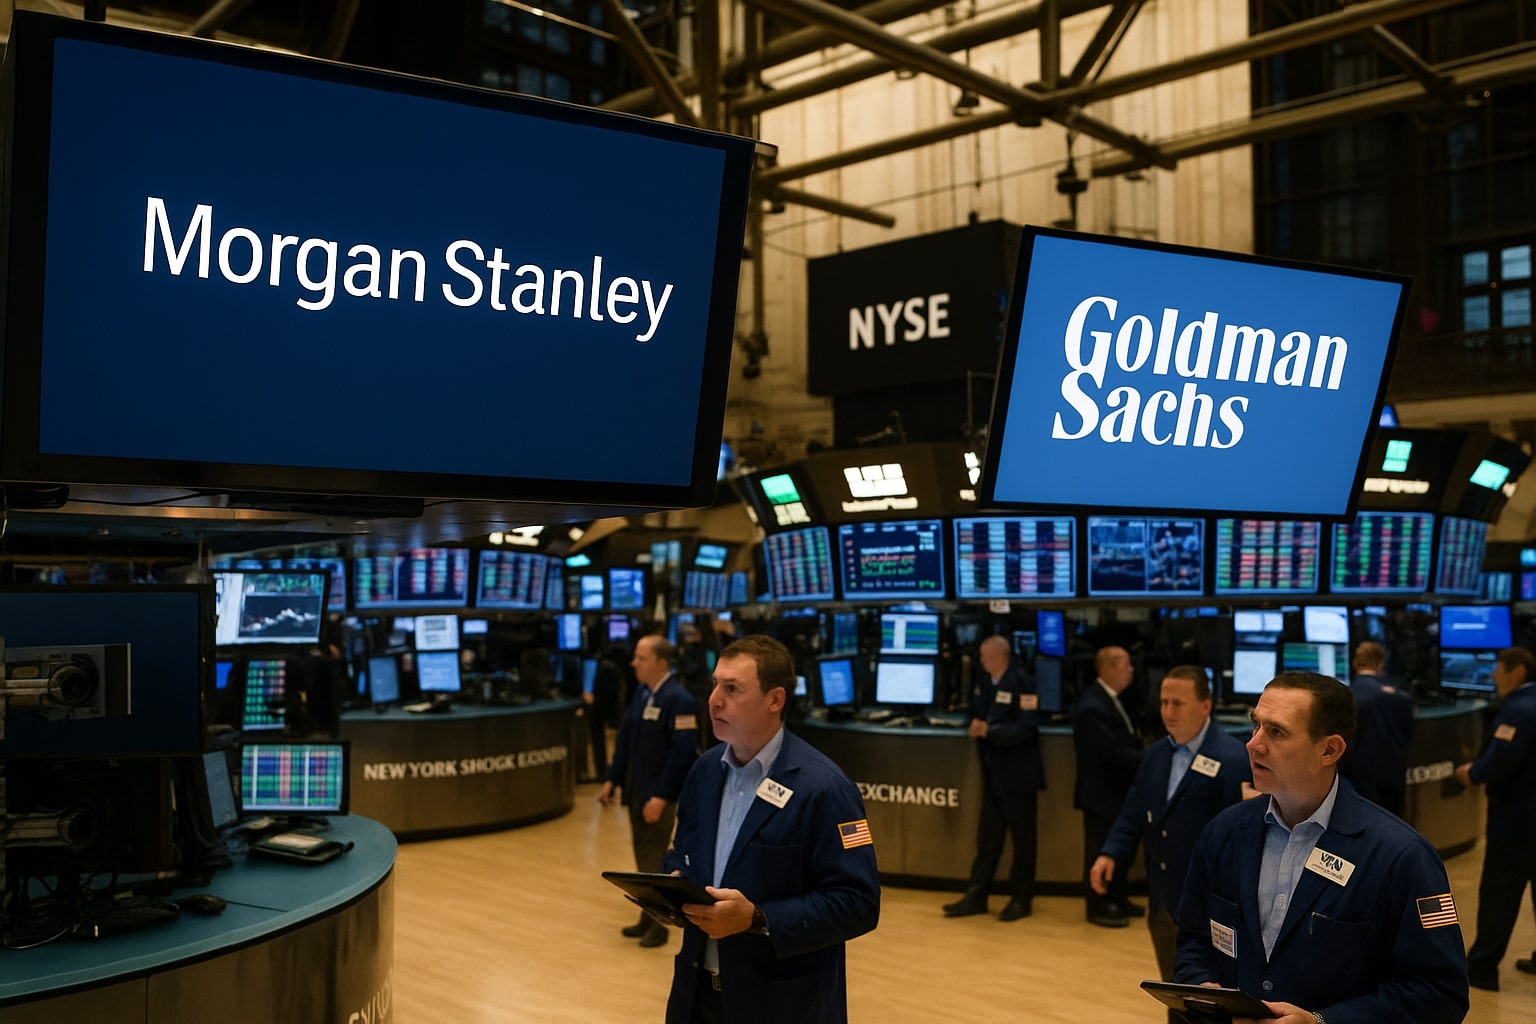
Morgan Stanley (NYSE:MS) vs Goldman Sachs (NYSE:GS): Head-to-Head Analysis
Stock Performance and Market Value Comparison
Morgan Stanley (NYSE:MS) trades at $156.39, near its 52-week high of $157.76, after delivering a 66.6% one-year gain and a 27.1% year-to-date increase. Its five-year return now stands at 264.8%, highlighting the strength of its wealth management and advisory model. By contrast, Goldman Sachs (NYSE:GS) trades at $780.06, close to its all-time high of $793.17, with a 67.9% one-year return and a 38.3% year-to-date gain, translating into a five-year return of 337.4%. While both have outperformed the S&P 500, Goldman’s total shareholder return has been stronger over a longer horizon, but Morgan Stanley is now the larger bank by market capitalization at $249.6B, compared to Goldman’s $236.1B.
Earnings and Revenue Growth
Morgan Stanley generated $65.61B in trailing revenue and $14.14B in net income, with EPS of $8.84. Quarterly earnings in Q2 2025 came in at $2.13 per share, topping estimates of $1.96. Analysts forecast EPS of $8.92 for 2025 and $9.60 for 2026, signaling mid-single-digit growth. Goldman Sachs reported $54.79B in revenue and $14.71B in net income, with EPS at $45.40, reflecting its higher trading-driven earnings power. Its Q2 2025 EPS was $10.91, beating expectations by $1.25, with analysts projecting $46.13 for 2025 and $52.11 for 2026. Goldman’s earnings growth trajectory remains stronger, especially with its investment banking rebound fueling top and bottom-line acceleration.
Profitability and Margins
Goldman Sachs boasts a 28.4% profit margin and an operating margin of 35.7%, while Morgan Stanley delivers a 22.5% profit margin and a 34.1% operating margin. Return on equity is higher at Morgan Stanley with 14.1%, compared to Goldman’s 12.7%, underscoring the efficiency of its wealth management-heavy mix. However, Goldman Sachs’ trading and investment banking activities generate higher per-share earnings leverage, which explains the wide EPS gap despite comparable net income.
Valuation Multiples
Morgan Stanley trades at a 17.7x trailing P/E and a 16.3x forward P/E, with a 2.54x price-to-book ratio and 4.07x price-to-sales. Goldman Sachs is cheaper on earnings, with a 17.2x trailing P/E and 14.9x forward P/E, and a lower 2.17x price-to-book and 4.52x price-to-sales. On a valuation basis, Goldman Sachs offers a discount relative to its growth profile, while Morgan Stanley commands a premium due to stability in its advisory and wealth management businesses.
Balance Sheet and Liquidity
Goldman Sachs carries $983B in cash against $732B in debt, resulting in a debt-to-equity ratio of 588% and a current ratio of 1.59. Morgan Stanley has $563B in cash with $479B in debt, translating into a debt-to-equity ratio of 438% and a current ratio of 2.13. Both are highly levered, as expected in global investment banks, but Morgan Stanley’s balance sheet appears slightly less stretched, while Goldman has greater liquidity buffers.
Capital Markets Exposure and Growth Drivers
Goldman Sachs’ Global Banking & Markets delivered $10.1B in Q2 2025 revenue, up 24% YoY, with investment banking fees surging 26% to $2.19B, FICC rising 9%, and equities soaring 36%. This broad-based rebound puts Goldman at the center of the capital markets recovery. Morgan Stanley’s strength lies in its M&A and IPO pipeline, with CEO Ted Pick calling it the strongest in a decade. Completed deals stood at $299B in H1 2025, though down 14% YoY. Healthcare and tech dominate its backlog, and IPOs surged with 188 filings in 2025, up 30% YoY. Both banks are positioned to benefit from the Federal Reserve’s rate cuts and improved trade clarity, but Goldman is more exposed to short-term trading gains, while Morgan Stanley relies on advisory and recurring wealth fees.
Read More
-
MicroStrategy Stock Price Forecast: MSTR Jumps Back Above $130 on 713K BTC and $2.25B Cash
13.02.2026 · TradingNEWS ArchiveStocks
-
XRP Price Forecast: Can XRP-USD Defend $1.35 Support After a 30% Slide?
13.02.2026 · TradingNEWS ArchiveCrypto
-
Oil Price Forecast: Oil Slide as Surplus Fears Replace War Premium
13.02.2026 · TradingNEWS ArchiveCommodities
-
Stock Market Today: AI Fears Hit Nasdaq as S&P 500 and Dow Struggle While AMAT and Rivian Rip Higher
13.02.2026 · TradingNEWS ArchiveMarkets
-
GBP/USD Price Forecast - Pound Holds 1.36 as Softer US CPI Revives June Fed Cut Expectations
13.02.2026 · TradingNEWS ArchiveForex
Dividend Policy and Shareholder Returns
Morgan Stanley pays an annual dividend of $4.00 per share, yielding 2.56%, with a payout ratio of 41.9%. Goldman Sachs raised its dividend to $16.00 annually, yielding 2.05%, with a lower payout ratio of 26.4%. MS offers higher yield but at a higher payout commitment, while GS has greater flexibility to raise its dividend further. Both banks have expanded dividends significantly in 2025, signaling management confidence.
Analyst Targets and Market Outlook
Morgan Stanley’s analyst target sits at $143.65, below its current $156.39, with some upside capped at $160. This suggests the stock is trading 8% above consensus fair value. Goldman Sachs carries a consensus target of $710.58, below the current $780, but the high-end target of $815 indicates room for continued upside. Both stocks are viewed as fully valued, but Goldman appears cheaper on multiples relative to growth.
Final Assessment: Morgan Stanley (NYSE:MS) vs Goldman Sachs (NYSE:GS)
Both stocks delivered extraordinary gains, with MS up 66.6% and GS up 67.9% over the past year. Morgan Stanley provides income stability through a higher yield and stronger ROE, making it appealing for defensive investors seeking predictable returns. Goldman Sachs, however, offers superior earnings growth, higher margins, and cheaper valuation multiples, making it better positioned for further upside if capital markets momentum persists. Based on the data, Goldman Sachs (NYSE:GS) is a Buy for growth-focused investors, while Morgan Stanley (NYSE:MS) is a Hold given its premium valuation but strong defensive profile.