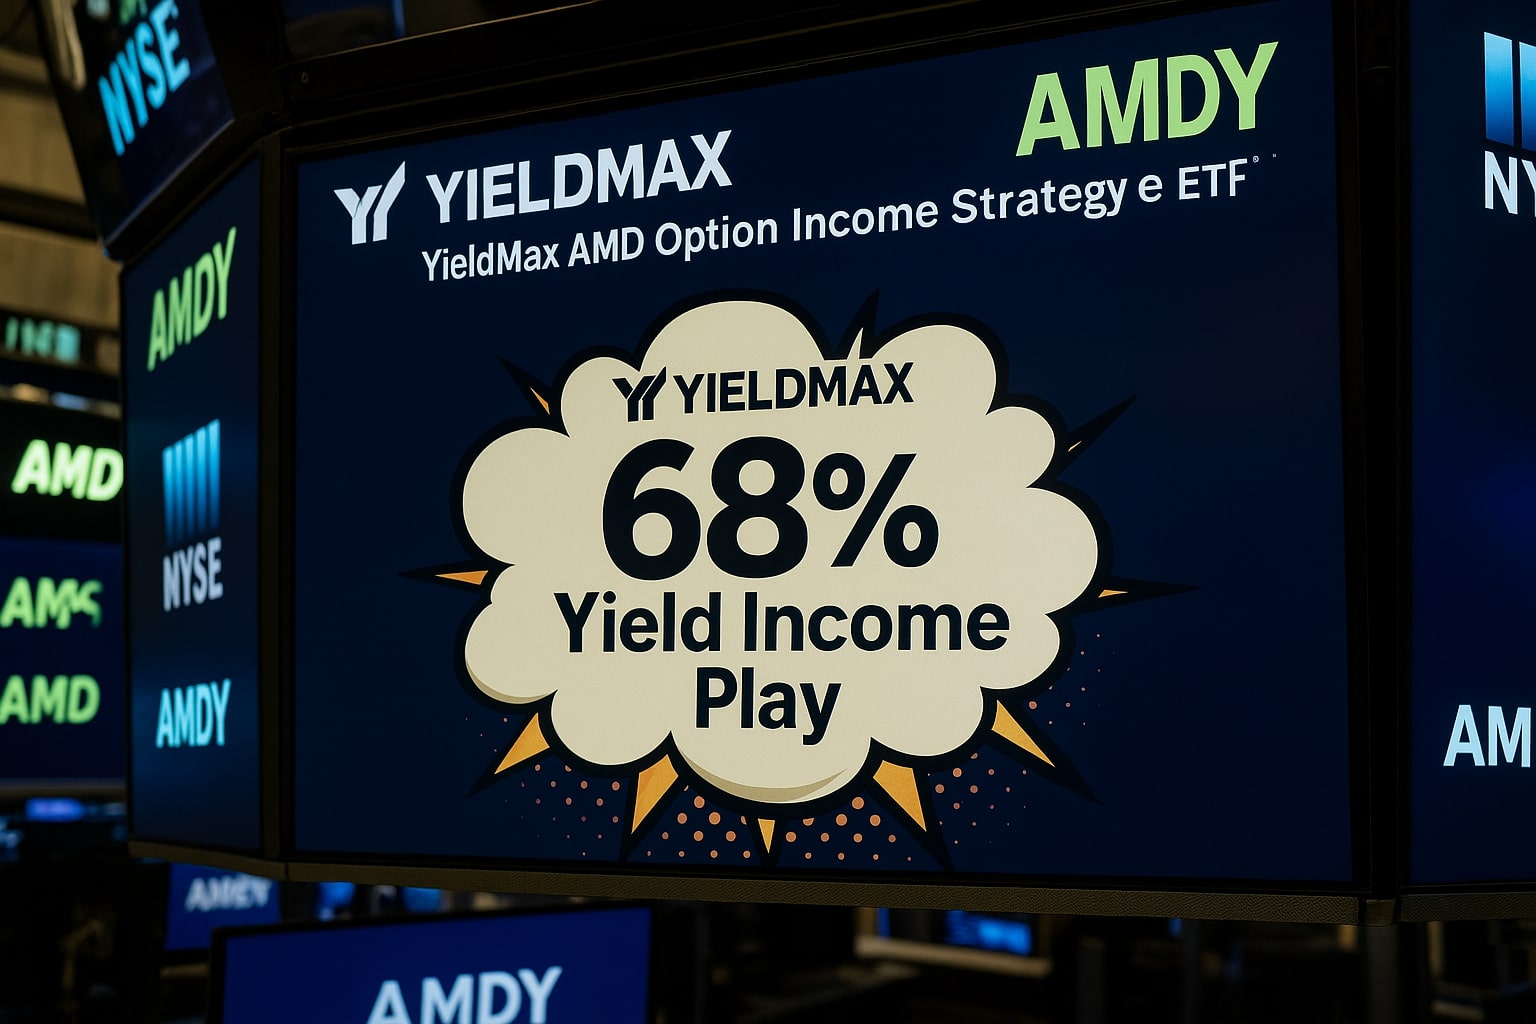
NYSEARCA:AMDY AMD ETF Turns AI Accelerator Momentum into a 68% Yield Income Play Ask ChatGPT
A granular exploration of AMDY’s synthetic long/covered-call framework, income sustainability, upside caps, downside risks, recent AI export and pricing drivers, and why income-focused investors are taking note | That's TradingNEWS
Fund Strategy and Synthetic Exposure
The YieldMax AMD Option Income Strategy ETF doesn’t own a single AMD share. Instead it simulates long exposure via purchased at-the-money calls paired with short puts, then writes out-of-the-money calls—typically struck 5–15 percent above spot—to harvest premiums. That covered-call overlay today yields an eye-watering 68 percent annualized payout, paid monthly, financed entirely by option income rather than dividend streams or share appreciation. This synthetic construct caps upside above each strike: when AMD shares rally past the $145, $155 or $165 calls that AMDY sold, the ETF simply hands that gain back, locking in the premium but foregoing further price upside. In contrast, on each 1 percent slide in AMD’s stock, AMDY absorbs the full drop, since the short puts leave no cushion beyond received call income.
Distribution Dynamics and Tax Efficiency
Since inception in September 2023, AMDY has disbursed $15.15 per share—nearly its entire $20 launch price—as return-of-capital distributions. In 2024 alone, distributions aggregated $11.12 per share; in H1 2025, another $2.47. While quarterly payouts once peaked at $1.67, they’ve normalized to around $0.46, reflecting NAV erosion. Critically, over 95 percent of each monthly payout is classified as return of capital, deferring tax until eventual sale and rendering AMDY unusually tax-efficient in a taxable account.
Capital Growth versus Income Trade-off
Total NAV appreciation since launch stands at 14.1 percent, far below AMD’s 36.7 percent share gain. Including distributions, AMDY’s trailing-twelve-month total return is just over 10 percent, underperforming the S&P 500’s roughly 12 percent in the same period. That gap underscores the yield-for-capital rightsizing: if AMD’s shares climb 30 percent in a quarter, AMDY may deliver only 5 percent of that via call premiums, while surrendering 30 percent of principal if AMD plunges. Historical peers confirm the pattern: YieldMax products on NVDA, TSLA, AAPL, and COIN have all lagged their underlyings by 20–40 percent since their respective inceptions, owing to capped upside and uncapped downside.
AI-Fueled Catalysts for AMD and the Knock-On Effect on AMDY
Advanced Micro Devices has posted 50 percent revenue growth in Data Center over the past four quarters, driven by MI300 series AI accelerators. In July 2025, U.S. regulators resumed export of AMD’s MI308X GPUs to China, unlocking an estimated $1.2 billion in incremental sales for the second half. Simultaneously, rumors of a 70 percent price hike on the MI350—from $15,000 to $25,000 per unit—could inject $2 billion more into AMD’s top line in FY 2025, boosting operating leverage on last quarter’s 45 percent gross margin. Each uptick in AMD’s volatility swells AMDY’s option premiums, potentially lifting monthly income above current levels.
Liquidity, Assets Under Management, and Trading Considerations
AMDY’s NAV hovers near $7.80, down from its $20 IPO, while daily trading volume averages 10,000 shares. That liquidity suffices for a modest position but makes large blocks susceptible to 0.5 percent price slippage. With net assets of $150 million, AMDY remains small, ensuring high expense ratio drag (1.23 percent) and underperformance against larger, more diversified covered-call ETFs. Investors must weigh that cost against 68 percent yield.
Risk Scenarios and Downside Triggers
If AI CapEx stalls—Morgan Stanley forecasts Data Center GPU spending to slow to 10 percent growth in FY 2026—or if China’s homegrown competitors erode AMD’s share, implied volatility on AMD options could collapse from current 45 percent to sub-30 percent. Such a drop would slash call premiums by nearly half, threatening monthly distributions and triggering further NAV draws. A sustained AMD share slide to $100, mirroring its Q1 2024 low, could drive AMDY NAV below $4.00, forcing distribution cuts and crystallizing delivered capital losses.
Positioning and Tactical Verdict
For income-hungry investors convinced that AMD’s AI momentum will persist—with MI300 family ramping 60 percent faster than consensus—AMDY offers an unprecedented 68 percent yield, effectively turning each $10,000 investment into $680 of annual pre-tax income. Yet the trade is not for those seeking pure equity growth: capital preservation hinges on excellent timing of entry, ideally after a sharp correction in AMDV volatility that inflates yields further. If your time horizon spans three years or more, and you’re willing to tolerate 50 percent NAV swings in pursuit of 50 percent-plus income, consider establishing a core position at current levels near $7.80—while layering slowly to average down on volatility dips.
We rate NYSEARCA:AMDY a Buy for income-focused portfolios with a bullish long-term view on AMD’s AI ascent, but caution that capital returns will markedly trail AMD’s equity performance in a raging bull market.
That's TradingNEWS
Read More
-
GPIQ ETF Price Forecast: Can a 10% Yield at $52 Survive the Next Nasdaq Selloff?
09.02.2026 · TradingNEWS ArchiveStocks
-
XRP ETF Price Forecast: XRPI at $8.32, XRPR at $11.86 as $44.95M Inflows Defy BTC and ETH Outflows
09.02.2026 · TradingNEWS ArchiveCrypto
-
Natural Gas Futures Price Forecast: Will The $3.00 Floor Hold After The $7 Winter Spike?
09.02.2026 · TradingNEWS ArchiveCommodities
-
Stock Market Today: Dow Back Under 50K While S&P 500 and Nasdaq Push Higher as Gold Reclaims $5,000
09.02.2026 · TradingNEWS ArchiveMarkets
-
USD/JPY Price Forecast: Can Bulls Clear 157.5 Without Triggering a 160 Intervention Line?
09.02.2026 · TradingNEWS ArchiveForex