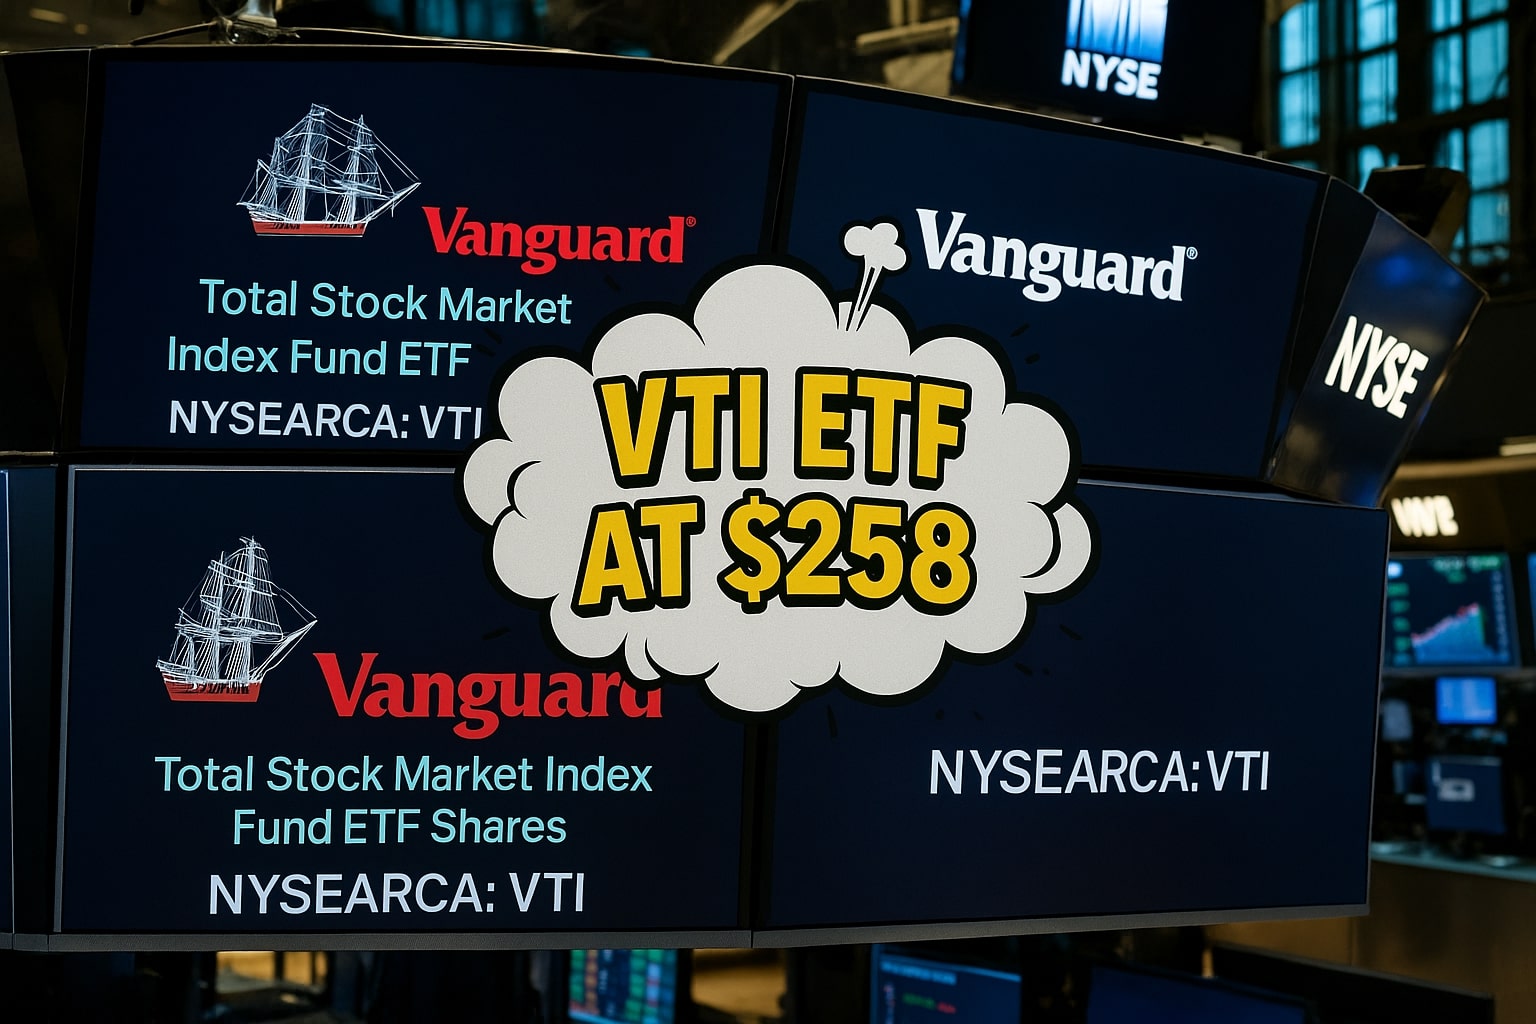
NYSEARCA:VTI ETF at $258: Broad Exposure or Blunt Instrument?
Why NYSEARCA:VTI Trails SPY and How Smart Tilts May Win | That's TradingNEWS
Broad But Blunt: Rethinking Exposure in NYSEARCA:VTI ETF Amid Shifting Market Dynamics
VTI's Mega-Cap Shadow Limits Broad Market Potential Even With 3,567 Holdings
Despite its reputation as a proxy for the entire U.S. stock market, NYSEARCA:VTI remains heavily skewed toward large caps. Its 3,567 holdings suggest diversification, but market cap weighting distorts exposure. Over 70% of VTI's weight is locked into large-cap names, making it structurally similar to SPY. Small and mid-cap stocks together represent only about 10%–15% of total exposure—insufficient to drive meaningful alpha during broad-based rallies.
This tilt has been a double-edged sword. When mega-caps dominate, VTI keeps pace with SPY. But when the rally broadens or volatility hits high-flyers, VTI underwhelms. As of June 2025, VTI trades near $258, having lagged SPY over 12 months, especially in AI-led surges dominated by the Magnificent Seven. Yet pre-COVID, VTI consistently outperformed, fueled by healthier contributions from smaller names and lower tech concentration.
Sector Allocation Shows Imbalance Despite Superficial Breadth
While VTI’s portfolio spans every economic sector, technology and consumer discretionary still dominate returns. Compared to SPY, VTI carries slightly less weight in these sectors but offers heavier exposure to financials, industrials, and real estate. These overweights have not translated to performance leadership, especially during tech-driven cycles. For example, the 2023–2025 rally saw SPY outpace VTI by more than 4.5% due to outsized gains in Nvidia, Meta, and Microsoft.
Meanwhile, VTI’s higher allocation to financials and real estate exposed it to drawdowns during 2022's rate-hike shock. This tilt, while adding diversification, added downside during tightening cycles without sufficient upside in neutral or accommodative environments.
Top Holdings Still Dictate Outcomes: Diversification in Name Only
VTI's top 10 holdings include Apple, Microsoft, Amazon, Nvidia, and Meta—mirroring SPY. Despite holding over 3,500 names, nearly 25% of VTI’s performance comes from these ten stocks. The average VTI investor may assume broad diversification, but returns remain disproportionately dictated by the same companies driving SPY. VTI’s diversification doesn’t shield against large-cap downturns—it simply dilutes potential upside from smaller-cap outperformers.
This effect is most visible in panic selloffs. During the 2020 COVID crash, VTI declined more than SPY as its modest small-cap allocation became a liability. Smaller firms, with weaker balance sheets and lower pricing power, fell harder. Yet during the initial recovery, when fiscal stimulus drove a market-wide rebound, VTI briefly outpaced SPY—showing that its structural tilt can work, but only in rare cycles of full-market participation.
Rate Cycles Punish Small and Mid Caps, Dulling VTI’s Edge
In the 2022–2023 tightening cycle, SPY once again outshined VTI. The latter’s additional exposure to mid- and small-cap names created a drag as higher rates disproportionately impacted rate-sensitive sectors. Valuation compression and risk-off positioning pushed institutional flows toward large, liquid names—weakening VTI’s relative appeal.
At the same time, VTI’s allocation to financials and real estate helped mute underperformance. These sectors underperformed, but their deep discount valuations buffered declines compared to frothier small-cap growth names. Even so, VTI trailed SPY by approximately 3.9% in total return between January 2022 and May 2024.
Smarter Tilts May Outperform: Why VOO + AVUV Is Gaining Ground
Many investors are beginning to question VTI’s efficiency. A growing cohort prefers pairing VOO (S&P 500 ETF) with a focused small-cap value ETF like AVUV. This tilt sheds VTI’s passive exposure to underperforming small-cap growth stocks and reallocates to historically stronger factors.
From 1972 to 2025, U.S. Small Cap Value delivered a 12.81% CAGR—beating large caps, small-cap growth, and the total market. Despite a higher 17.99% volatility, the long-term payoff and improved return distribution favor value tilts. AVUV’s cost of 0.25% is higher than VTI’s 0.03%, but blended portfolios still clock in at only 0.085%–0.14% in fees—manageable given the historical outperformance.
A 50/50 blend of VOO and AVUV outpaced VTI in every 20-year rolling period tested, especially post-dot-com crash and after the 2020 recovery. These mixes avoid VTI’s long tail of low-conviction small caps, reducing drag and improving terminal wealth. The distribution curve also favors the VOO/AVUV mix—showing more consistent positive compounding and less mass near zero.
Holding VTI Means Owning the Tail, Not Just the Leaders
While VTI does deliver market beta, it also includes thousands of thinly traded, low-growth names with high bid-ask spreads. Roughly 3,000 of its holdings contribute negligible return and increase portfolio noise. By contrast, a curated portfolio of 588 stocks from a VOO + AVUV mix maintains factor clarity and improves capital efficiency.
Terminal wealth modeling supports this thesis. Over a 30-year horizon, VTI underperforms a blended 75/25 VOO/AVUV allocation by up to 11%, net of fees. This outperformance isn’t dependent on timing or luck, but on structural factor exposure—particularly the small-cap value premium.
VTI’s Use Case Narrowed by AI-Led Concentration Risk
The ongoing dominance of AI-fueled mega caps has reignited SPY’s performance leadership. With Nvidia, Apple, and Microsoft alone accounting for nearly 18% of market cap gains YTD in 2025, VTI finds itself trailing—not because it lacks those names, but because it owns too much else. In narrow rallies, VTI becomes a relative laggard.
However, if macro trends shift—e.g., lower rates, more fiscal stimulus, or a broader rotation—VTI could regain ground. Historically, it has outperformed in such setups, particularly during post-crisis recoveries. But the setup needs to align with cyclical tailwinds and factor normalization.
Verdict: Hold With Tactical Trim Toward Value Tilts
At $258 and trading at 19.6x forward earnings, NYSEARCA:VTI still offers long-term core exposure, but not without caveats. Investors seeking sharper risk/reward tradeoffs may benefit from trimming into a VOO + AVUV combination. This strategy retains market stability while enhancing small-cap value exposure—a factor that has repeatedly demonstrated superior long-term compounding.
As mega-cap valuations stretch further, and market breadth narrows, investors may want to reduce passive exposure to VTI’s inefficiencies. The ETF is a Hold, but only for those prioritizing simplicity. For optimized portfolios, a blend may deliver better results with only modest fee creep. The shift isn’t radical—it’s rational.
That's TradingNEWS
Read More
-
GPIQ ETF Price Forecast: Can a 10% Yield at $52 Survive the Next Nasdaq Selloff?
09.02.2026 · TradingNEWS ArchiveStocks
-
XRP ETF Price Forecast: XRPI at $8.32, XRPR at $11.86 as $44.95M Inflows Defy BTC and ETH Outflows
09.02.2026 · TradingNEWS ArchiveCrypto
-
Natural Gas Futures Price Forecast: Will The $3.00 Floor Hold After The $7 Winter Spike?
09.02.2026 · TradingNEWS ArchiveCommodities
-
Stock Market Today: Dow Back Under 50K While S&P 500 and Nasdaq Push Higher as Gold Reclaims $5,000
09.02.2026 · TradingNEWS ArchiveMarkets
-
USD/JPY Price Forecast: Can Bulls Clear 157.5 Without Triggering a 160 Intervention Line?
09.02.2026 · TradingNEWS ArchiveForex


