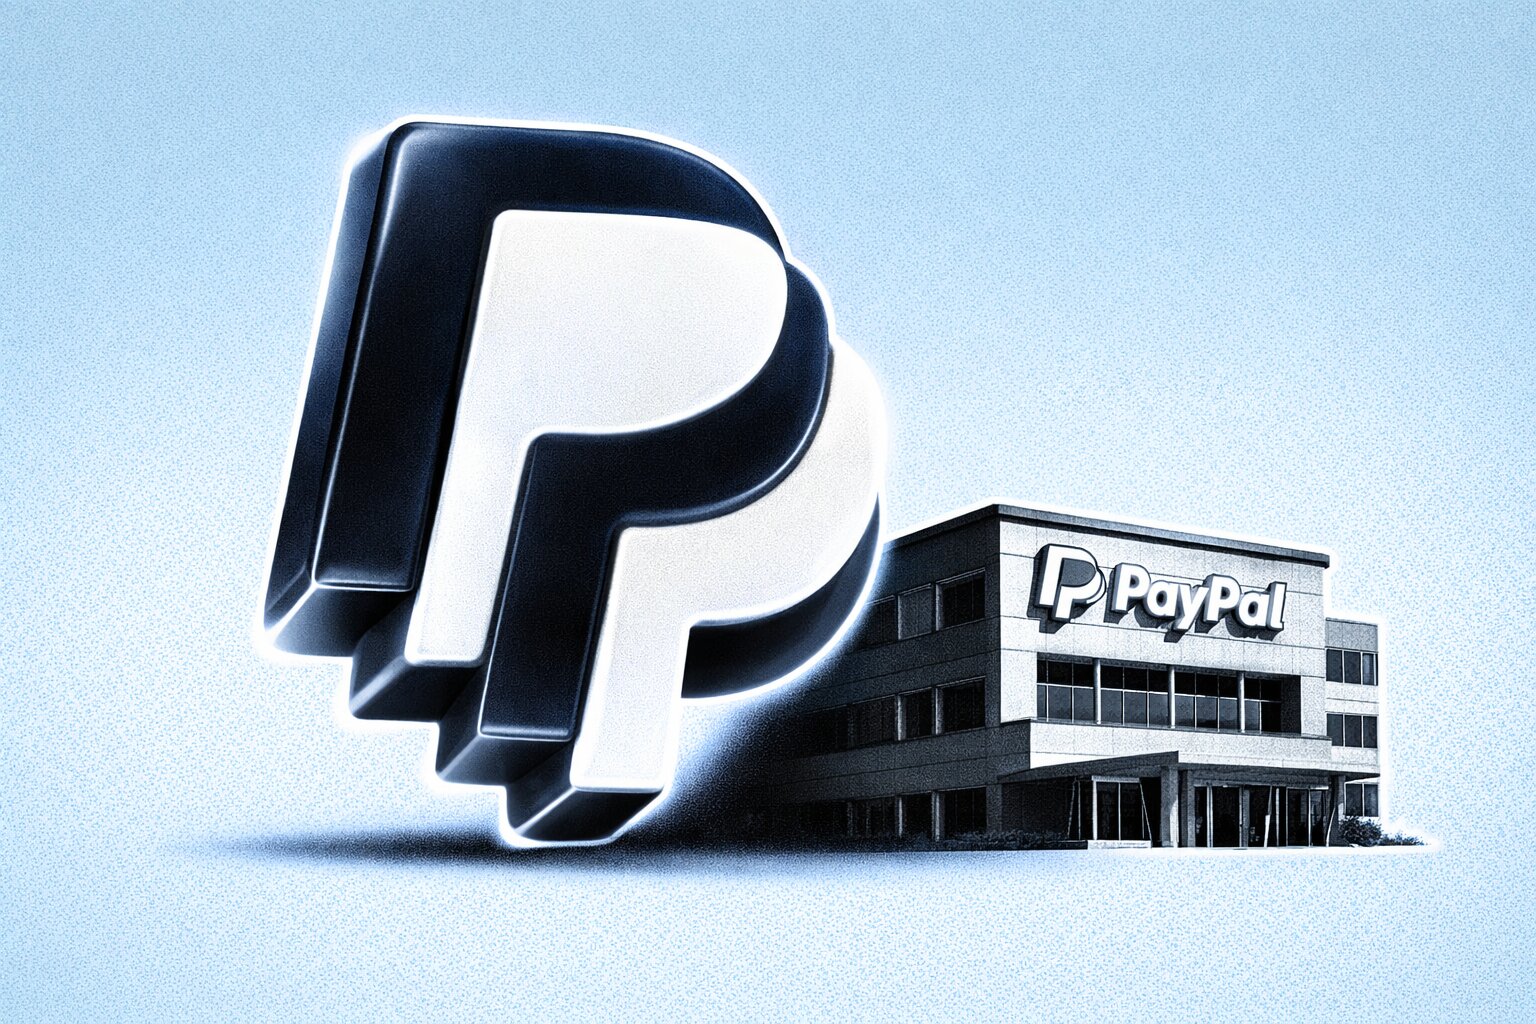
PayPal Stock Price Forecast - PYPL at $41: Deep Q4 Reset, Single-Digit P/E and a $6B Buyback on Deck
After the Q4 guidance cut, CEO shake-up and branded checkout slowdown, PayPal (PYPL) still delivers $8.7B in quarterly revenue, $6.4B in annual FCF and plans $6B in 2026 repurchases, leaving the stock at contrarian levels around $41 | That's TradingNEWS
PayPal Stock (NASDAQ:PYPL): distressed pricing on a functioning payments engine
PayPal Stock (NASDAQ:PYPL) trades around $41–42 per share, with a forward P/E close to 7.5–7.8 and a market cap near $38–39 billion. The equity has dropped roughly 28–29% in a month, around 47% over twelve months, and about 87% from the >$300 peak in 2021, taking the price back to levels last seen in 2017. That collapse comes despite revenue rising by roughly $22.3 billion since 2016 (around +206%), gross profit climbing by about $8.6 billion (+168%), EBITDA and net income expanding more than +200% and +270%, and only one year in the last decade with gross margin under 40%. The multiple now reflects a structurally impaired story even though the financial statements still show modest growth, high-teens free cash flow margins and continuous share count reduction.
Revenue, margins and cash generation: fundamentals that do not match the chart
Over the 2025 fiscal year, PayPal generated around $1.79 trillion in total payment volume (TPV), up about 7% year on year, with Q4-25 TPV of roughly $475 billion, up 9%. Full-year revenue grew about 4% and Q4-25 revenue reached roughly $8.68 billion, also up ~4% versus the prior year period. Q4-25 EPS came in near $1.53, about 38% higher year on year, with full-year EPS around $5.46; after backing out a $0.14 benefit from the investment portfolio, underlying EPS sits around $5.32, a small ~2.5% decline. Adjusted free cash flow was about $6.4 billion, implying an FCF margin near 16–17%. Margin structure remains robust: gross margin around 41–42%, EBITDA margin about 20%, free cash flow margin in the mid-teens, net income margin near 16%. At the current price, the stock trades at less than 6x EBITDA, operating income and cash from operations, under 7x free cash flow and roughly 8x net income. Those are deep-value numbers for a franchise that still grows revenue and processes nearly $2 trillion in annual TPV.
Segment mix: branded checkout stagnates while newer engines accelerate
The primary operational problem is not volume, but composition. Branded online checkout, which still represents roughly 31% of TPV, saw growth slow sharply from about +6% in Q4-24 to roughly +1% in Q4-25, effectively flat during a key holiday quarter when several peers posted double-digit gains. That slowdown, combined with guidance calling for only “slightly positive to low single-digit” branded checkout growth in 2026, justifies part of the market’s concern: a core higher-yield product is losing momentum during peak demand season. In contrast, newer growth engines are performing strongly. Venmo now has over 100 million accounts, with around 67 million monthly actives, up about 7% year on year. Venmo revenue reached roughly $1.7 billion in 2025, growing about 20%, supported by rising average revenue per active (up mid-teens), broader debit card usage and greater “Pay with Venmo” adoption. BNPL volumes grew around 21% in 2025 on top of strong prior-year growth, indicating share gains against rivals whose revenue expansion is slowing. The PSP and enterprise payments segment returned to healthier growth, with TPV up about 8% in Q4-25 and 5% for the year, versus around 6% in Q4-24, while delivering seven consecutive quarters of profitable growth, improved merchant retention, more value-added services and roughly doubled net processing yields.
Transactions, quality of volume and the bear narrative on engagement
Total payment transactions fell about 4% in 2025 to roughly 25.4 billion, which on the surface supports a negative narrative around weakening engagement and lower usage per account. But the detail shows deliberate reshaping rather than pure erosion. Transactions excluding PSP increased around 6% to about 16.1 billion and trailing-twelve-month payment activity excluding PSP rose roughly 5%. Combined with 7% TPV growth and 6% transaction margin growth, this points to a mix shift away from low-yield PSP and unbranded processing toward healthier volume, not a collapse in platform relevance. If the user base were walking away, TPV, revenue and transaction margin would not show simultaneous growth. The bear case correctly highlights pressure in the branded checkout core and a dip in transactions per account, but it overstates the idea that the ecosystem is structurally collapsing when newer segments and higher-quality flows are actually expanding.
Take rates and economics: stability so far, with risk if incentives escalate
Q4-25 take rate stood near 1.65%, about 9 basis points lower year on year. Viewed in isolation, that looks like meaningful fee pressure; viewed across the full year, take rates were broadly stable quarter to quarter, with the year-on-year decline largely reflecting a strong Q4-24 comparison. The guided ~3-point drag on transaction margin from incentives and product investments is already influencing the current metrics. For take rates to structurally compress from here, one of three things would need to happen: a durable, broad-based repricing in favor of merchants, a sustained shift into much lower-yield volume without offsetting monetization gains, or a step-change increase in incentive intensity. Current evidence points elsewhere. Management cites vaulted-card conversion success around 95%, biometrics delivering 2–5 percentage-point conversion gains and double-digit growth for merchants that integrate the latest checkout stack. PSP and Venmo monetization trends are improving, not deteriorating. The need to deploy targeted incentives and secure placements confirms a competitive environment, but the numbers do not yet show a structural breakdown in pricing power.
Read More
-
VOO ETF Price Near $634 as AI Capex and Tariff Shock Rewire the S&P 500
22.02.2026 · TradingNEWS ArchiveStocks
-
XRP ETF XRPI And XRPR: $1.40 XRP, $4B Ripple Deals And A Tight Supply Squeeze
22.02.2026 · TradingNEWS ArchiveCrypto
-
Natural Gas Price Near $3.05 as Bomb Cyclone and Global Supply Stress Collide
22.02.2026 · TradingNEWS ArchiveCommodities
-
USD/JPY Price Forecast: Yen Shock Turns 155 Into a Make-or-Break Level
22.02.2026 · TradingNEWS ArchiveForex
EPS path, guidance reset and what the buyback actually does
From an earnings perspective, 2025 remains positive. EPS of around $5.46 (or $5.32 excluding the investment bump) grew double-digits year on year at the headline level and low-single-digits on an underlying basis. Guidance for 2026 is conservative: transaction margin dollars excluding interest on customer balances are expected to be roughly flat, and adjusted EPS is guided to a range from a low-single-digit decline to slightly positive growth. Consensus assumes revenue around $34.2 billion in 2026 (roughly +3% year on year) and EPS of about $5.34, rising to roughly $5.82 in 2027 and $6.45 in 2028. Those estimates already factor in a reset of growth expectations and assume only high-single-digit EPS expansion. Against that, the capital return policy is aggressive. The board plans about $6 billion of buybacks in 2026. At a $50 average repurchase price, that would retire around 120 million shares, or about 12.5% of the roughly 959 million shares used in 2025 EPS calculations; at a $47 average, retirement climbs to around 13.3%. At the current ~$41–42 share price quoted on PayPal Stock (NASDAQ:PYPL), the same $6 billion could remove an even larger percentage of the float. Since 2019, cumulative buybacks have already cut share count by about 20%; in 2025 alone they removed roughly 7.3% of the float. There is also scope to add another $5 billion from the balance sheet, which would lift total repurchases toward $11 billion, equivalent to close to 30% of the current market cap if executed at these levels. If management deploys that firepower while operating income is at least stable, EPS can overshoot current 2026–2028 expectations purely through share count reduction.
Valuation versus history and peers: deep discount with clear value-trap risk
On valuation, PayPal trades at a forward P/E of roughly 7.5–7.8x versus a one-year average multiple near 12.5x, a five-year average around 23x and a ten-year average close to 28x. The current multiple is also below the November 2023 trough near 9.4x, despite higher free cash flow and a lower share count today. Using a three-year expected EPS CAGR of about 6.7%, the implied PEG ratio is roughly 1.1x, cheaper than the five-year PEG mean near 1.5x and broadly in line with, or slightly below, the wider sector. Compared with peers, the discount is sharper: many fintech names trade in the mid-teens to low-20s forward P/E range; card networks sit in the mid-20s; several BNPL and neobank players command far higher multiples on weaker profitability. PayPal’s price-to-book ratio of around 1.7x looks modest relative to peer averages around 2.1x, with Q4-25 book value per share around $22 and management’s 2026 buyback plan likely to push that figure toward the mid-$20s, potentially around $26 if the float drops toward ~790 million shares. The risk side is straightforward: the stock has already round-tripped a decade of gains and could remain stuck at single-digit multiples if branded checkout continues to stagnate, competitors widen their lead in high-growth verticals and the market concludes the franchise is ex-growth. In that scenario, PayPal becomes a classic value trap where cash generation and buybacks do not translate into higher valuation.
Balance sheet strength and CEO’s strategic levers
The balance sheet gives management room to act. PayPal holds around $10.4 billion of cash and short-term investments and roughly $4.3 billion in long-term investments, against about $10.0 billion of long-term debt, with annual interest expense near $440 million. Free cash flow of about $6.4 billion in 2025 comfortably covers debt service, buybacks and internal investment. The workforce of roughly 23,800 people represents another lever. A targeted reduction in force, focused on non-core or lower-productivity functions, could lift operating margins and potentially free billions for additional capital returns without destabilizing the core platform. The new CEO, Enrique Lores, arrives with a track record of restructuring HP Inc., pivoting that business beyond PCs and printers and driving shareholder value via portfolio focus and efficiency. Here, he inherits a payments network with positive TPV growth, high-teens FCF margins, a committed $6 billion buyback program and a P/E multiple in the high-single-digits. That combination allows a shift toward harder cost discipline, sharper capital allocation and tighter prioritization of growth bets in Venmo, BNPL, enterprise payments and modernized checkout, while pruning initiatives that do not clear an adequate return hurdle. Monitoring insider transactions and the broader company profile will be important to see whether leadership aligns personal capital with the buyback and turnaround narrative.
Macro environment, sector sentiment and why the stock has been punished
The macro backdrop for fintech remains hostile. Cooling inflation and a resilient labor market have pushed out expectations for rapid rate cuts, which compresses valuation multiples on long-duration growth equities and makes high-quality cash-generative companies more attractive only if growth visibility is clear. At the same time, consumer behavior is splitting: higher-income cohorts continue to spend, supported by asset gains, while lower-income cohorts cut back as inflation erodes purchasing power and job security feels less certain. That “K-shaped” dynamic weighs on discretionary ecommerce and fuels concern that volume growth for transaction-based models could slow further. Within that setting, PayPal has delivered underwhelming 2026 guidance, withdrawn its long-term targets and executed leadership changes, amplifying the idea that management visibility is low and that the core branded checkout franchise has lost competitiveness. The sector itself has derated, but PayPal has suffered more than most because it sits awkwardly between high-growth fintech and mature payments utility: it is not growing fast enough to justify premium multiples, yet its metrics are still too strong for the market to ignore the risk of structural erosion.
Asymmetry, key risks and verdict on PayPal Stock (NASDAQ:PYPL)
At around $41–42 per share, PayPal Stock (NASDAQ:PYPL) is priced for disappointment across multiple dimensions: branded checkout growth stuck near zero, limited operating leverage, modest EPS expansion and no sustained re-rating. The current forward P/E in the high-single-digits, the ability to retire 10–15% of the float annually at these levels and the persistence of high-teens free cash flow margins create an asymmetric setup if execution stabilizes the core and scales the faster-growing segments. The upside case is straightforward: even without heroic assumptions, a move to a low-teens multiple on $5.8–6.0 of EPS would push the share price into the low- to high-$60s, implying roughly 40–70% potential appreciation from current levels before any incremental improvement in growth or margins. The downside case is also clear: branded checkout continues to lose share, competitive pressure forces more incentives and fee concessions than anticipated, revenue growth stalls, management under-delivers on cost and capital allocation and the market keeps the stock at or below a 7–8x P/E band for years. In that scenario, returns rely mainly on buybacks and a small dividend while the share price moves sideways or drifts lower. Weighing the numbers and the current pricing, this looks less like a failing business and more like a functioning franchise with a broken narrative. The risk profile is not low, but the compression in valuation and the scale of cash generation tilt the balance toward opportunity rather than permanent impairment. On that basis, at current prices PayPal Stock (NASDAQ:PYPL) aligns more with a contrarian Buy than a Hold, with the caveat that position size should reflect the real possibility that 2026 remains a trough year and that sentiment may take time to recover.