Gold Price Forecast: XAU/USD Holds Above $5,000 After CPI Shock and Liquidity Flush
Gold rebounds from the $4,915 low to trade back over $5,000 as softer 2.4% CPI, lower US yields and renewed safe-haven flows keep XAU/USD targeting the $5,150–$5,350 resistance band | That's TradingNEWS
Gold Price Forecast – XAU/USD holds above $5,000 as volatility explodes
Macro pulse: softer CPI, lower yields and a friendlier backdrop for Gold
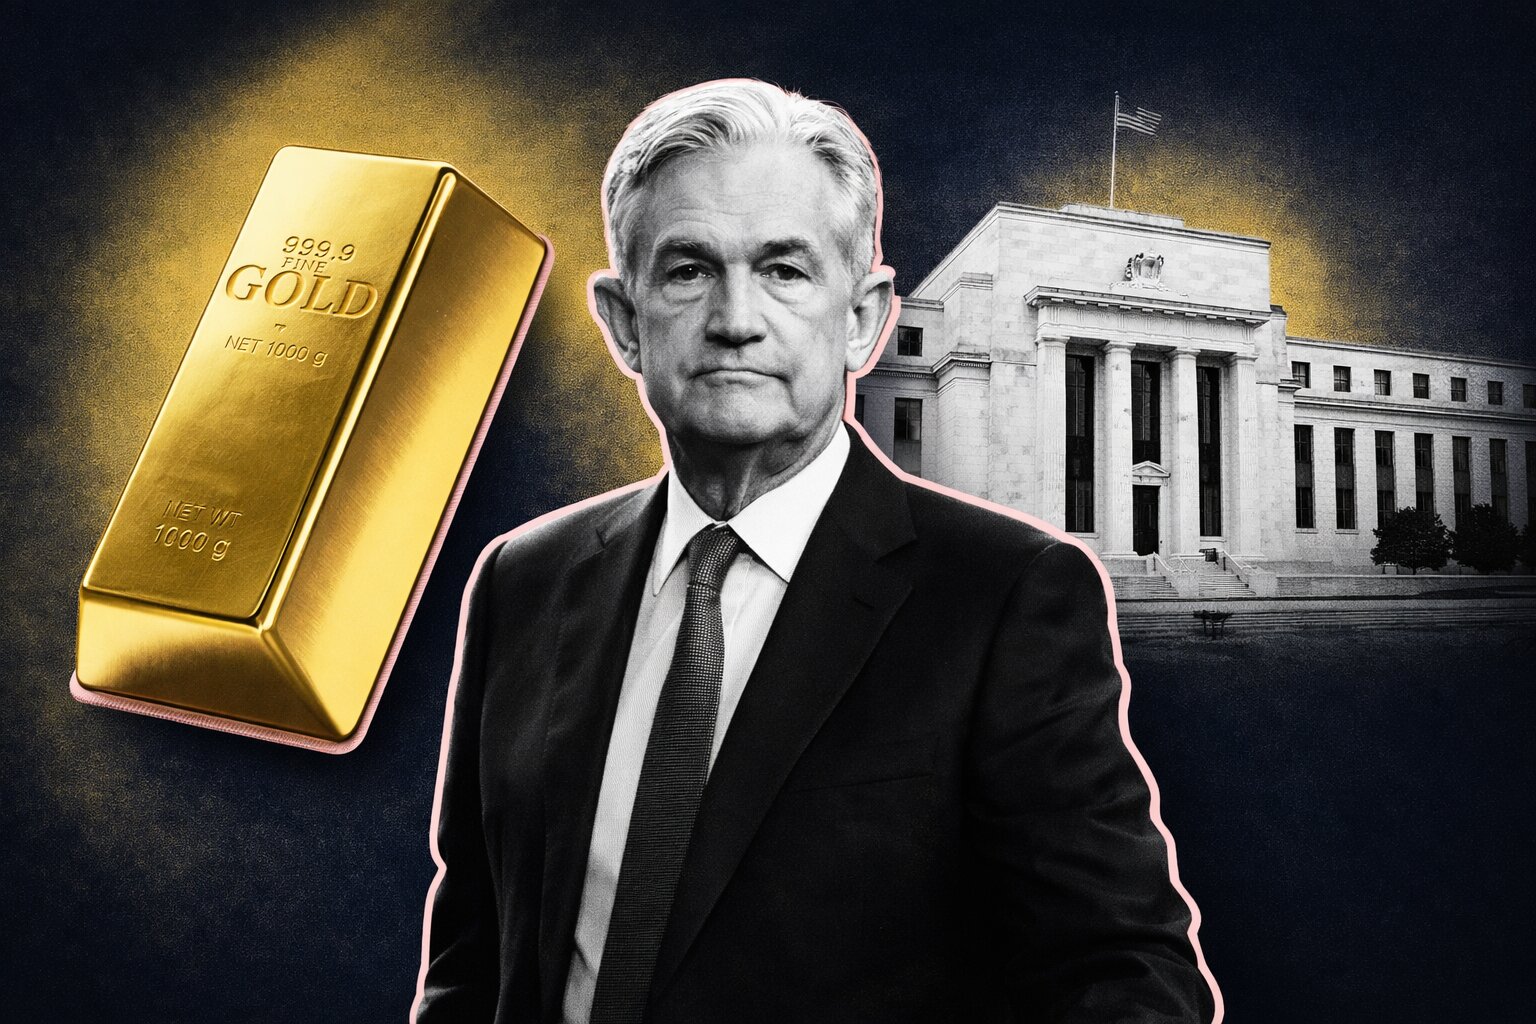
Gold trades back above $5,000 per ounce, rebuilding a floor after a violent shake-out that briefly drove spot toward $4,915. The rebound was triggered by cooler US inflation: January CPI slowed to roughly 2.4% year-on-year, under the 2.5% expectation, and core inflation eased as well. That print pushed Treasury yields lower and revived expectations of multiple Fed rate cuts into year-end. Rate-cut odds now reflect roughly a 50% chance of at least a third cut before December, a clearly more supportive backdrop for a non-yielding asset like Gold (XAU/USD). Every basis-point drop in real yields matters at this price level: it directly improves the opportunity cost of holding bullion, especially for institutions that benchmark against cash or Treasuries. The latest move shows that even after a parabolic run, gold is still highly sensitive to marginal shifts in the policy path.
Whipsaw for Gold: forced selling, then aggressive dip-buying above $4,900
The last week was a textbook whipsaw. Early on, XAU/USD was pinned in a tight $5,010–$5,080 range as mixed US data (weak retail sales vs. strong jobs) kept macro positioning cautious but not panicked. The real damage came when a sharp equity sell-off – driven by tech and AI-linked names – triggered a cross-asset de-risking wave. High-beta trades were liquidated, and gold did not escape: leveraged longs were dumped to raise cash and meet margin calls, sending spot down to roughly $4,915 in hours. That drop was not driven by a change in gold’s fundamental story; it was a liquidity event. Once forced selling slowed, buyers stepped back in, particularly after cooler CPI confirmed that the Fed is closer to easing than tightening. Spot then snapped back above the $5,000 handle, with intraday spikes up to around $5,016–$5,050, showing that dip-buyers still treat gold as a core hedge whenever macro stress collides with easier policy expectations.
Technical picture for XAU/USD: $4,600–$4,900 as demand zone, $5,150–$5,350 as upside band
Technically, the structure remains constructive, not broken. On the futures side, April gold recently traded near $4,993, with first resistance around $5,016–$5,100 and stronger resistance projected in the $5,150–$5,350 band. That zone corresponds to the upper stretch of the current rising channel and would mark the next leg higher if safe-haven flows or weaker USD push the market further. On the downside, several layers of support are visible. The first line is Thursday’s low near $4,900, then the broader structural base around $4,600–$4,700, which has acted as the breakout cluster of this entire leg higher. As long as daily closes stay above roughly $4,900, the market is still trading from a position of strength. Only a decisive break below the $4,600 region would signal a deeper trend reversal rather than a sharp correction in a powerful bull move.
Read More
-
Broadcom Stock Price Forecast: AVGO at $325 Ahead of AI-Driven Earnings
14.02.2026 · TradingNEWS ArchiveStocks
-
XRP Price Forecast: Ripple XRP-USD Climbs Back to $1.47 but $1.80 Wall and Sub-$1 Risk Still Dominate
14.02.2026 · TradingNEWS ArchiveCrypto
-
Natural Gas Futures Price Holds Around $3.20 as Storage Tightens and Winter Premium Fades
14.02.2026 · TradingNEWS ArchiveCommodities
-
Stock Market Weekly Recap: S&P 500 Stalls, Nasdaq Leads the Decline, Dow Eases as AMZN, NVDA, AAPL Sell Off
14.02.2026 · TradingNEWS ArchiveMarkets
-
GBP/USD Price Forecast - Pound Stuck at 1.36 as Fed Cut Hopes Clash With UK Weakness
14.02.2026 · TradingNEWS ArchiveForex
Volatility regime: flash crashes, risk-off waves and what they really mean for Gold
The recent “flash crash” in gold is a symptom of the current volatility regime, not a sign that the bull case has disappeared. Algorithmic and CTA-style models amplify intraday trends, especially when gold trades near all-time highs and positioning is crowded. In the latest move, a risk-off wave linked to AI and growth stocks forced broad deleveraging across futures, commodities and indices at the same time. Gold’s role flips during extreme stress: instead of being purely a safe haven, it becomes a source of liquidity to plug holes elsewhere. The message is simple: expect sharp $150–$300 swings around the $5,000 mark, both up and down. For anyone running exposure, the key is position sizing and time horizon. The underlying structure – inflation gradually cooling but still above target, high global debt, and fragile risk sentiment – remains aligned with elevated gold prices even if the path there is rough.
Domestic support: India’s Gold demand and high-price adaptation in USD terms
Physical demand is still doing its job as a stabiliser, even at these new price levels. In India, one of the largest bullion markets, 24-carat gold recently traded around the equivalent of $5,500–$5,700 per ounce when converting local quotes (roughly $1,55,000–$1,57,000 per 10g) into USD. The key takeaway is not the exact conversion but the fact that buyers are still active despite record-high domestic prices. The $5,450–$5,500 per-ounce equivalent acts as an important demand absorption band; whenever global prices dip, wedding season and long-term savers step in to pick up metal, cushioning deeper drawdowns. At the same time, jewellery demand in Western markets is adapting rather than collapsing. Retailers are moving toward designs that use less metal weight – lighter chains, open-link structures, more minimalistic settings – to hold key price points while gold remains above $5,000. That shift means consumption value stays high even if tonnage is constrained, keeping a firm underlying floor under the market.
Jewellery, margins and premiumisation: how high Gold prices reshape the market in USD
Higher gold prices are reshaping the jewellery sector but not destroying it. With spot above $5,000, brands are protecting margins by using thinner shanks, hollow components and mixed-metal constructions, while still marketing pieces as premium. At the same time, there is a clear “premiumisation” trend: fewer small ticket items, more focus on one or two larger purchases per buyer. In dollar terms, that means average ticket sizes climb even if unit volumes flatten. Consumer behaviour confirms this: many are prepared to pay four-figure sums in USD for a single meaningful item rather than multiple lower-value products. For bullion, this pattern is supportive. It implies that even at historically high prices, end-user demand is not collapsing – it is climbing the value curve. That makes it harder for bears to argue that jewellery demand will implode and kill the rally.
Macro triggers to watch: Fed cuts, USD path and geopolitical risk for XAU/USD
The next legs for XAU/USD will be driven by three main macro levers, all of which tie directly into USD levels. First, the Fed’s path: with CPI running near 2.4% and growth data mixed, odds have increased for multiple cuts by year-end. Every additional 25 bps cut priced into the curve puts more downward pressure on real yields, historically a strong tailwind for gold. Second, the dollar: if weaker US data or renewed risk appetite push the dollar index lower, dollar-denominated gold above $5,000 becomes easier to sustain. Third, geopolitics and financial-stability risk: any renewed shock – whether from energy markets, sovereign debt, or regional conflict – tends to produce spikes in safe-haven flows. In dollar terms, that’s exactly how you get fast extensions from $5,000 toward $5,300–$5,500 without much time for repositioning.
Directional verdict on Gold (XAU/USD) – bias, risk zones and Buy/Sell/Hold call in USD
Putting price action and macro together, gold still leans bullish, not neutral. The metal survived a forced-liquidation event, reclaimed the $5,000 handle, and continues to trade inside a rising multi-year channel with demand clustered between roughly $4,600 and $4,900 per ounce in USD terms. As long as daily closes stay above that band and US data keeps the Fed in a cutting posture rather than a hiking stance, the path of least resistance points to further tests of $5,150–$5,350, and potentially a stretch higher if another macro shock hits. The risk side is clear: a clean break below $4,600 would open air down toward the low $4,300–$4,400 zone and mark a deeper correction. Until that happens, the structure does not justify a bearish stance. On balance, Gold / XAU/USD at current levels aligns more with a “Buy with volatility” than a Sell, with position size and leverage calibrated to tolerate $200–$300 swings around the $5,000 anchor in USD.