Gold Prices Climb: Bullish Trends Driven by CPI, Dollar, and Yields
Analyzing the Impact of Economic Data and Market Dynamics on Gold's Bullish Outlook | That's TradingENWS
CPI, Dollar, and Yields Drive Gold Prices Higher
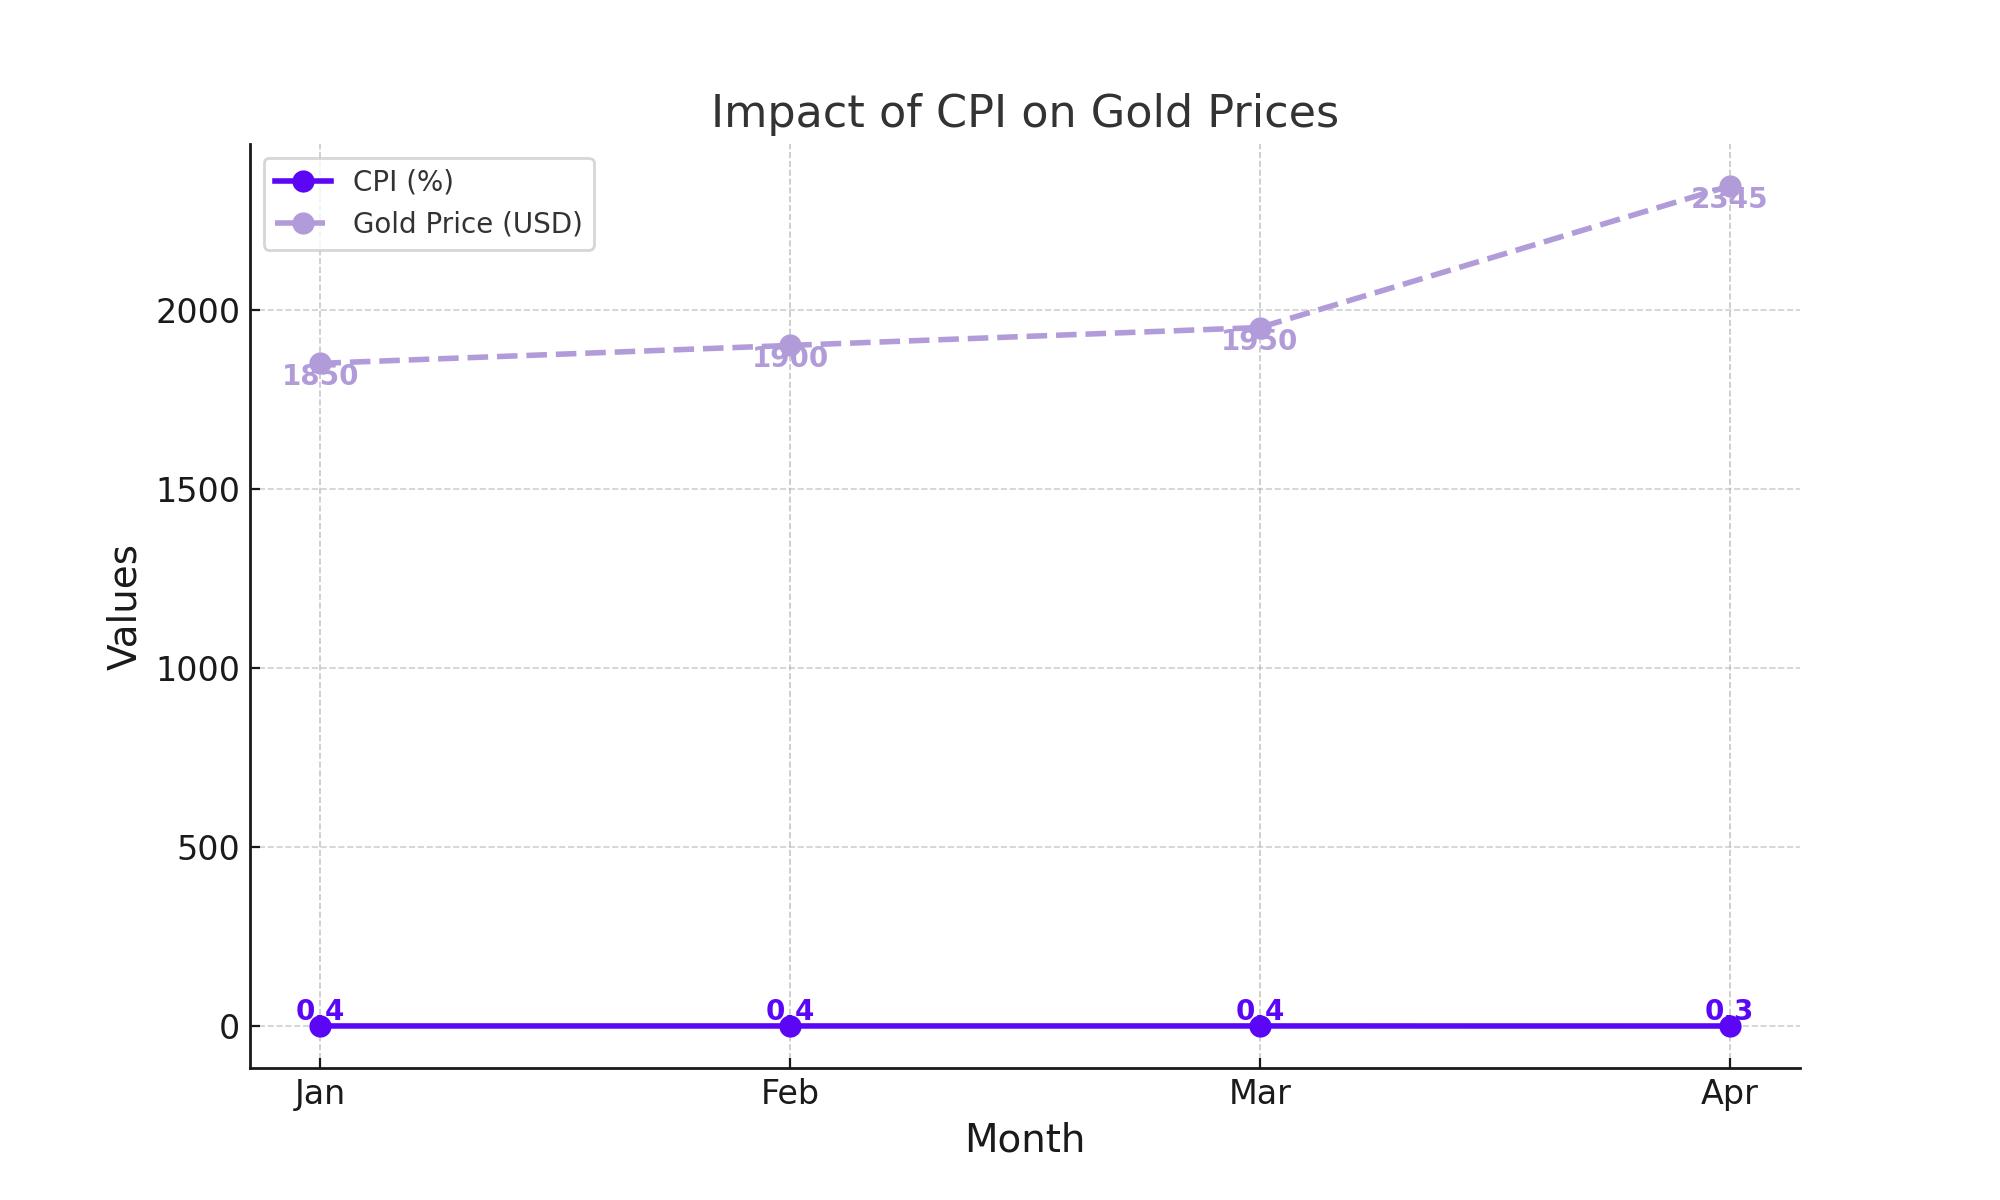
Impact of CPI on Gold Prices
Recent economic data reveals that the US Consumer Price Index (CPI) has had a significant impact on gold prices. Monthly CPI dropped from 0.4% to 0.3%, with both headline and core measures aligning with estimates but reflecting lower values. This decrease in inflation has relieved market concerns, leading to a sell-off in the US dollar, as measured by the DXY (US Dollar Index). A weaker dollar typically makes gold more attractive, as it reduces the opportunity cost of holding non-interest-bearing assets like gold. Concurrently, US Treasury yields have fallen sharply, adding to gold's appeal.
Bullish Continuation in Gold Prices
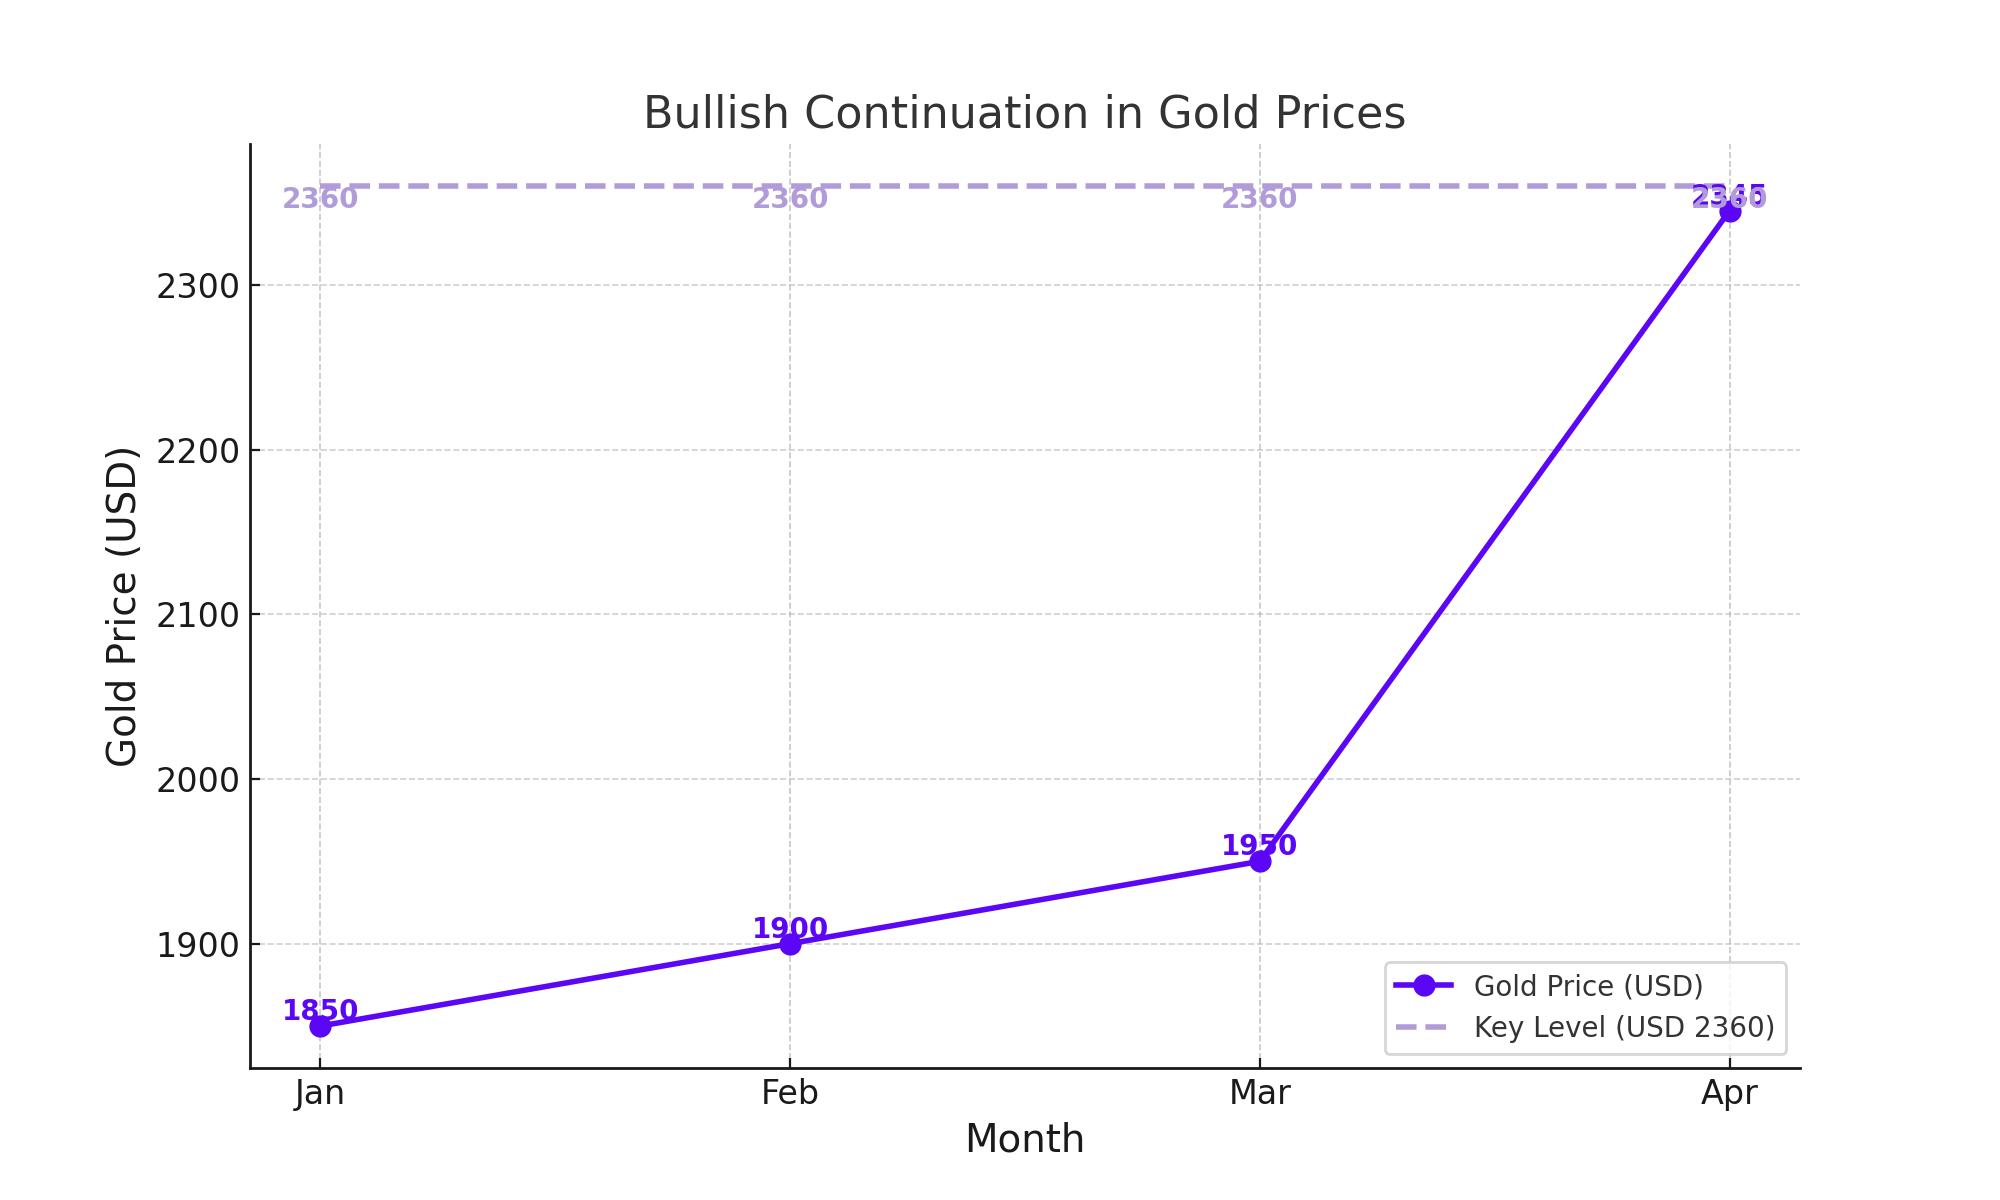
Gold prices are poised to test all-time highs, driven by softer CPI data and a dovish shift in interest rate expectations. The market is pricing in two full rate cuts by the end of the year, which has spurred a bullish sentiment for gold. After trading within a bearish channel, gold prices broke above trendline resistance, signaling a potential continuation of the longer-term bullish trend. Key levels to watch include a retest of prior resistance at approximately $2,360, now serving as support. This level aligns with the 1.618% Fibonacci extension from the 2020-2022 decline, representing a significant confluence point.
Volatility and Sustained Bullish Momentum
Gold's price movement often benefits from volatile environments, which create a risk-off sentiment among investors. While lower interest rates support higher gold prices, sustained bullish momentum requires more significant catalysts, such as substantial economic weakness or deterioration in the job market. As of now, the long-term bullish outlook for gold hinges on further rate cut expectations.
Gold Mining Costs and Margins
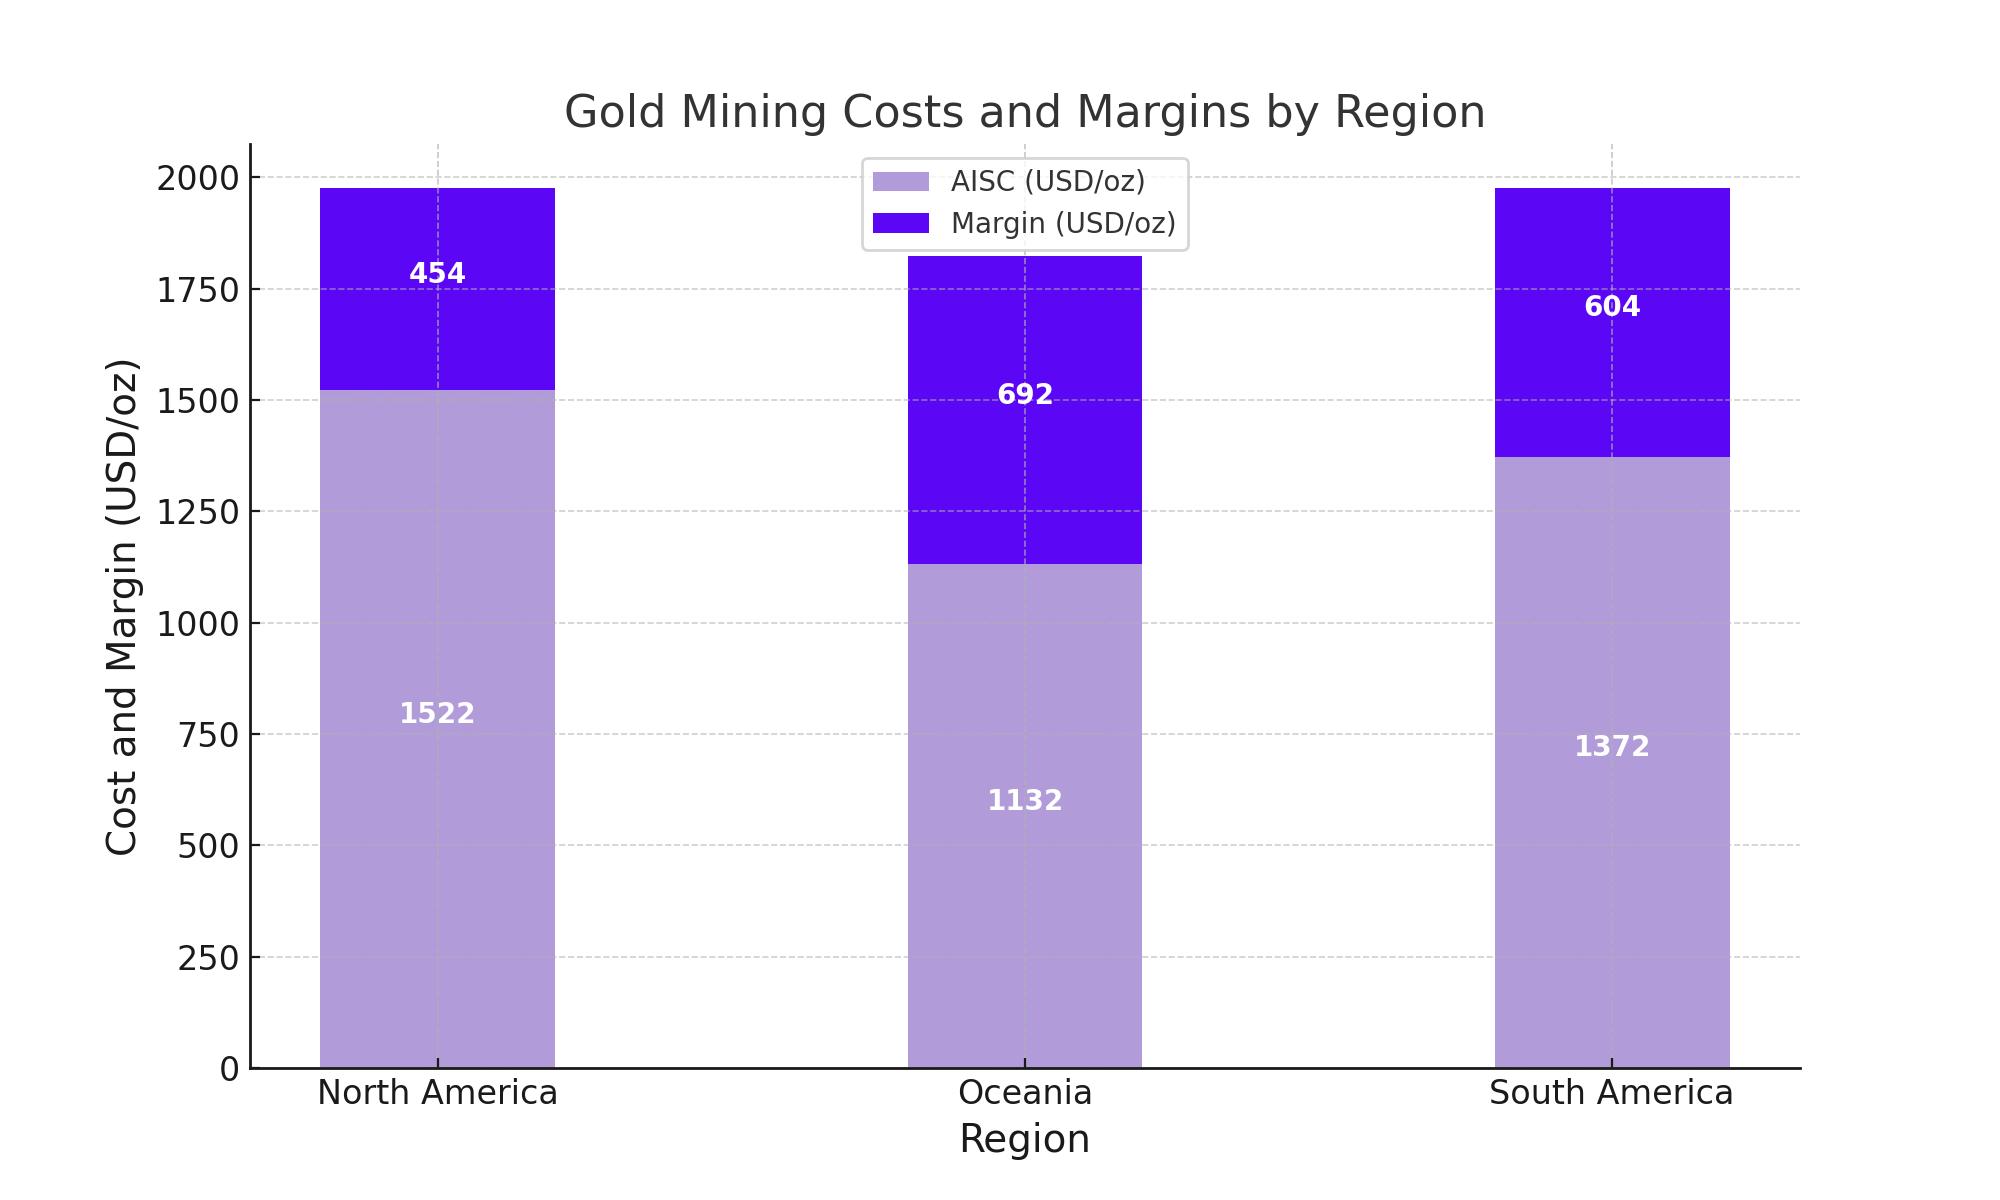
In Q4 2023, gold miners saw a 2% quarterly increase in global average all-in sustaining costs (AISC), reaching $1,342 per ounce. Despite persistent cost inflation and a tight labor market, higher gold prices have provided some relief, with the global average margin at $635 per ounce, based on a spot price of $1,977 per ounce. This margin is approaching the healthier levels seen in early 2022 but remains below the record margins of 2020.
Regional cost variations highlight the complexities of the gold mining industry. In North America, AISC rose by 2% to $1,522 per ounce, resulting in a margin of $454 per ounce. This region continues to experience higher costs, driven by increased total cash costs (TCC) and sustaining capital expenditures. Conversely, Oceania saw a 1% rise in AISC to $1,132 per ounce, with an average margin of $692 per ounce. South America experienced a 3% decrease in AISC to $1,372 per ounce, with a margin of $604 per ounce, benefiting from higher grades processed and lower TCC.
Gold's Response to US Economic Data
The gold price (XAU/USD) gained traction as the US dollar weakened following the release of April's CPI report. The CPI showed a slower inflation rate, prompting speculation about potential Federal Reserve rate cuts later in the year. Lower interest rates reduce the cost of investing in gold, bolstering its attractiveness. Traders will focus on upcoming US economic indicators, including building permits, housing starts, initial jobless claims, the Philly Fed Manufacturing Index, and industrial production. Federal Reserve officials' comments will also influence market sentiment.
Market Movers and Technical Analysis
The US CPI increased by 3.4% year-over-year in April, down from 3.5% in March. Monthly, headline CPI inflation dropped to 0.3% from 0.4%, while core CPI inflation, excluding food and energy, rose by 3.6% year-over-year, down from 3.8%. Retail sales were flat in April, missing expectations of a 0.4% increase. These figures have reinforced the market's expectation of a rate cut by September, with a 75% probability, up from 65% before the CPI report.
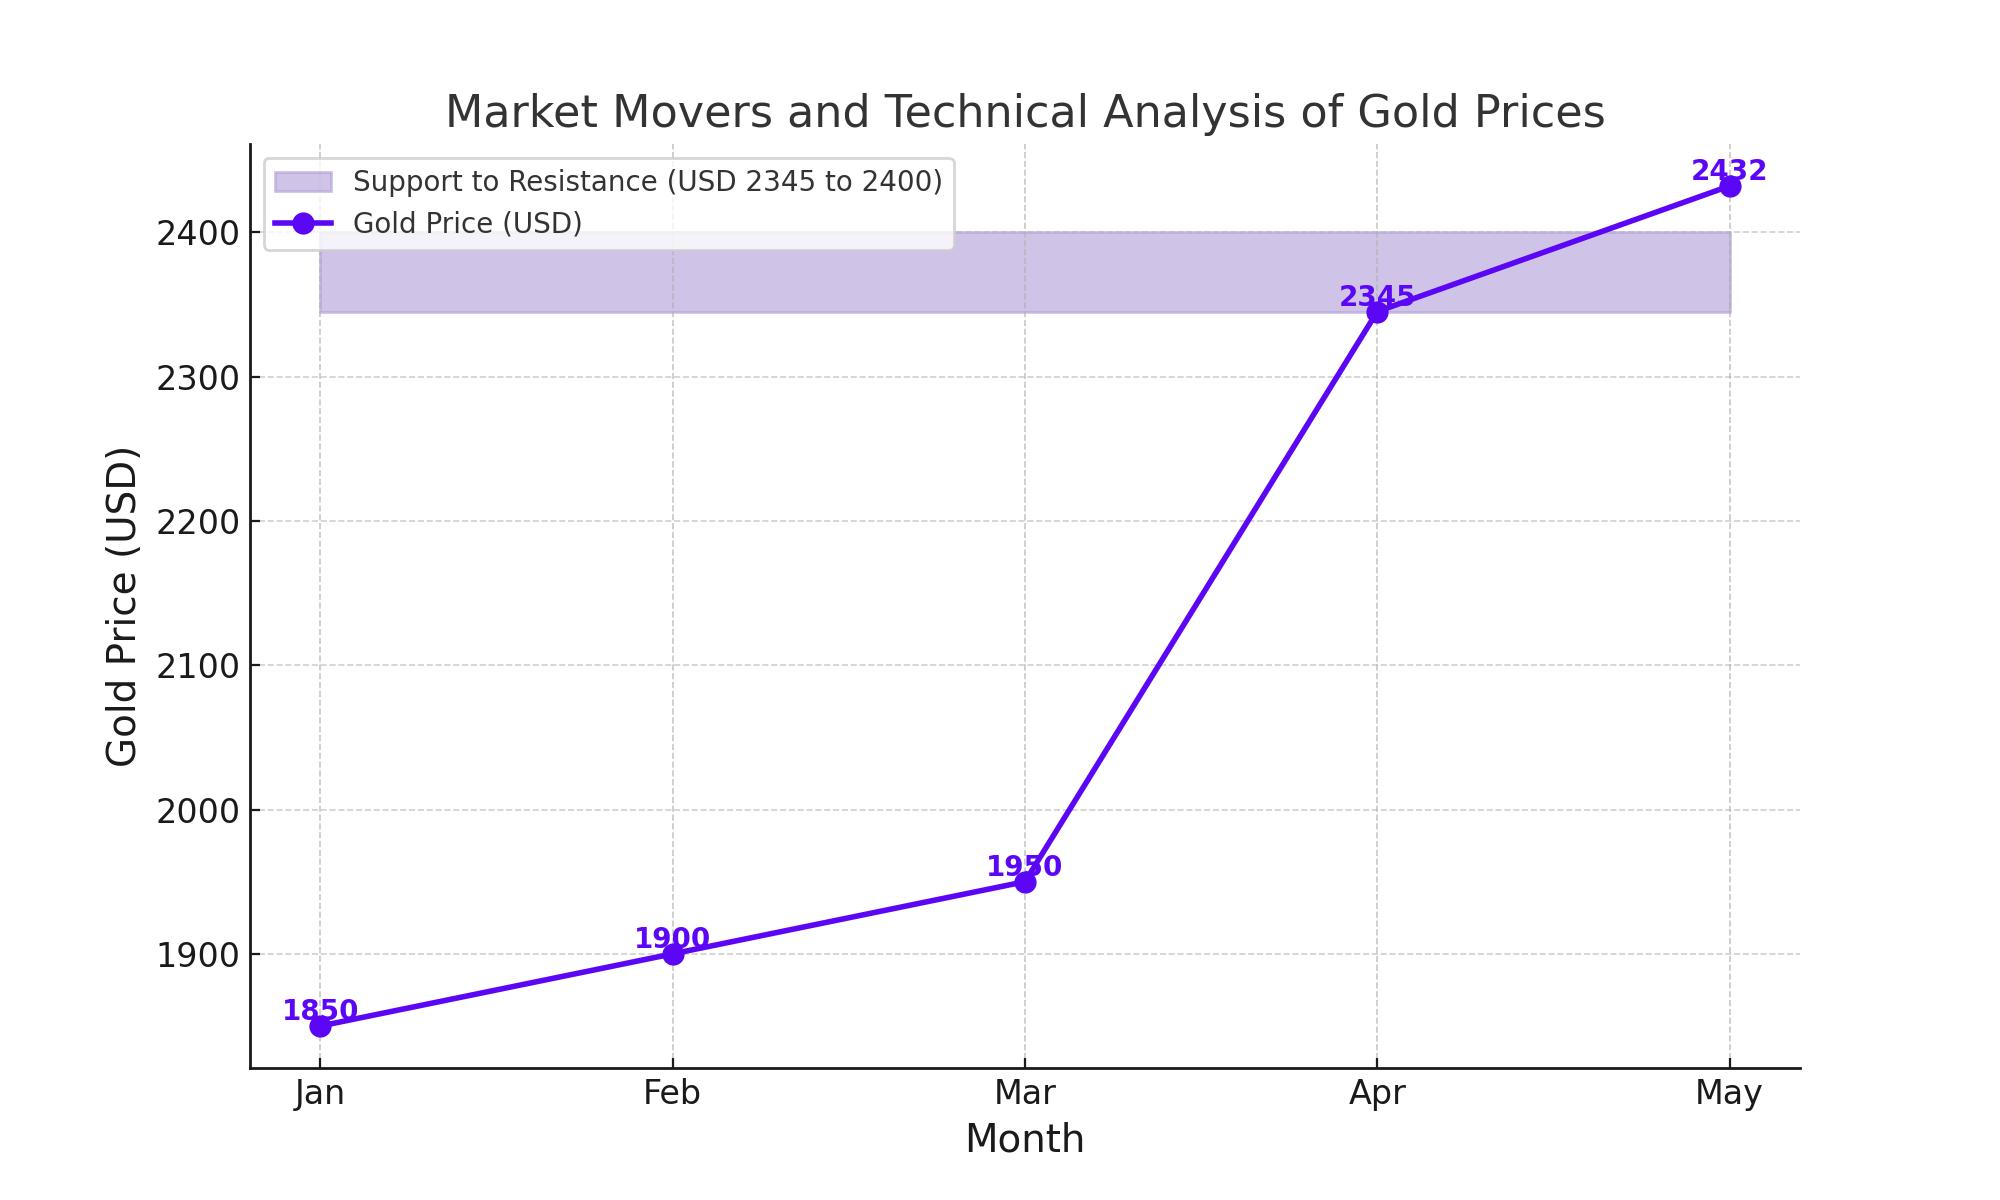
The World Gold Council reported a 3% increase in global gold demand to 1,238 tonnes in Q1 2024, marking the strongest first quarter since 2016. Technically, gold maintains a bullish outlook, forming an ascending trend channel since May 2. The Relative Strength Index (RSI) is in bullish territory at around 72, indicating potential consolidation before further upside. Key resistance levels include $2,400 and the all-time high of $2,432, with support at $2,345 and $2,334.
Inflation Data and Gold Price Correlation
Recent US inflation data has provided a positive outlook for gold prices. April's CPI data showed that inflation is back on a downward trend, alleviating concerns among traders and investors. Federal Reserve Chairman Jerome Powell's statements have been mixed, but the expectation of interest rate cuts remains strong. If inflation data continues to improve, a rate cut could occur as early as July.
Geopolitical Factors and Gold Demand
Beyond the US Federal Reserve's monetary policy, a significant factor impacting gold prices is the shift from a dollar-denominated trade system. Countries like China and Russia are increasingly conducting trade in their own currencies, boosting gold's importance as a reserve asset. This trend underscores the need for substantial gold reserves to support national currencies, providing stability in times of currency crises. As more countries follow suit, the demand for gold is likely to increase, further supporting its price.
Price Action and Future Outlook
Gold prices are nearing critical levels, flirting with all-time highs. Recent movements have positioned gold against resistance, with the potential for gradual upward movement towards the trend line. As long as prices remain above the 50-day simple moving average, the bullish trend is likely to continue. Immediate support is seen at $2,345, with resistance at the all-time high of $2,432.
Read More
-
IVV ETF Price Forecast: Is $684 Still Worth Paying For S&P 500 Exposure?
14.02.2026 · TradingNEWS ArchiveStocks
-
XRP ETF Rally: XRPI at $8.09 and XRPR at $11.60 as XRP-USD Rebounds Toward $1.47
14.02.2026 · TradingNEWS ArchiveCrypto
-
Natural Gas Futures Price Holds Around $3.20 as Storage Tightens and Winter Premium Fades
14.02.2026 · TradingNEWS ArchiveCommodities
-
USD/JPY Price Forecast: Yen Strength Turns 152 into a Make-or-Break Level
14.02.2026 · TradingNEWS ArchiveForex


