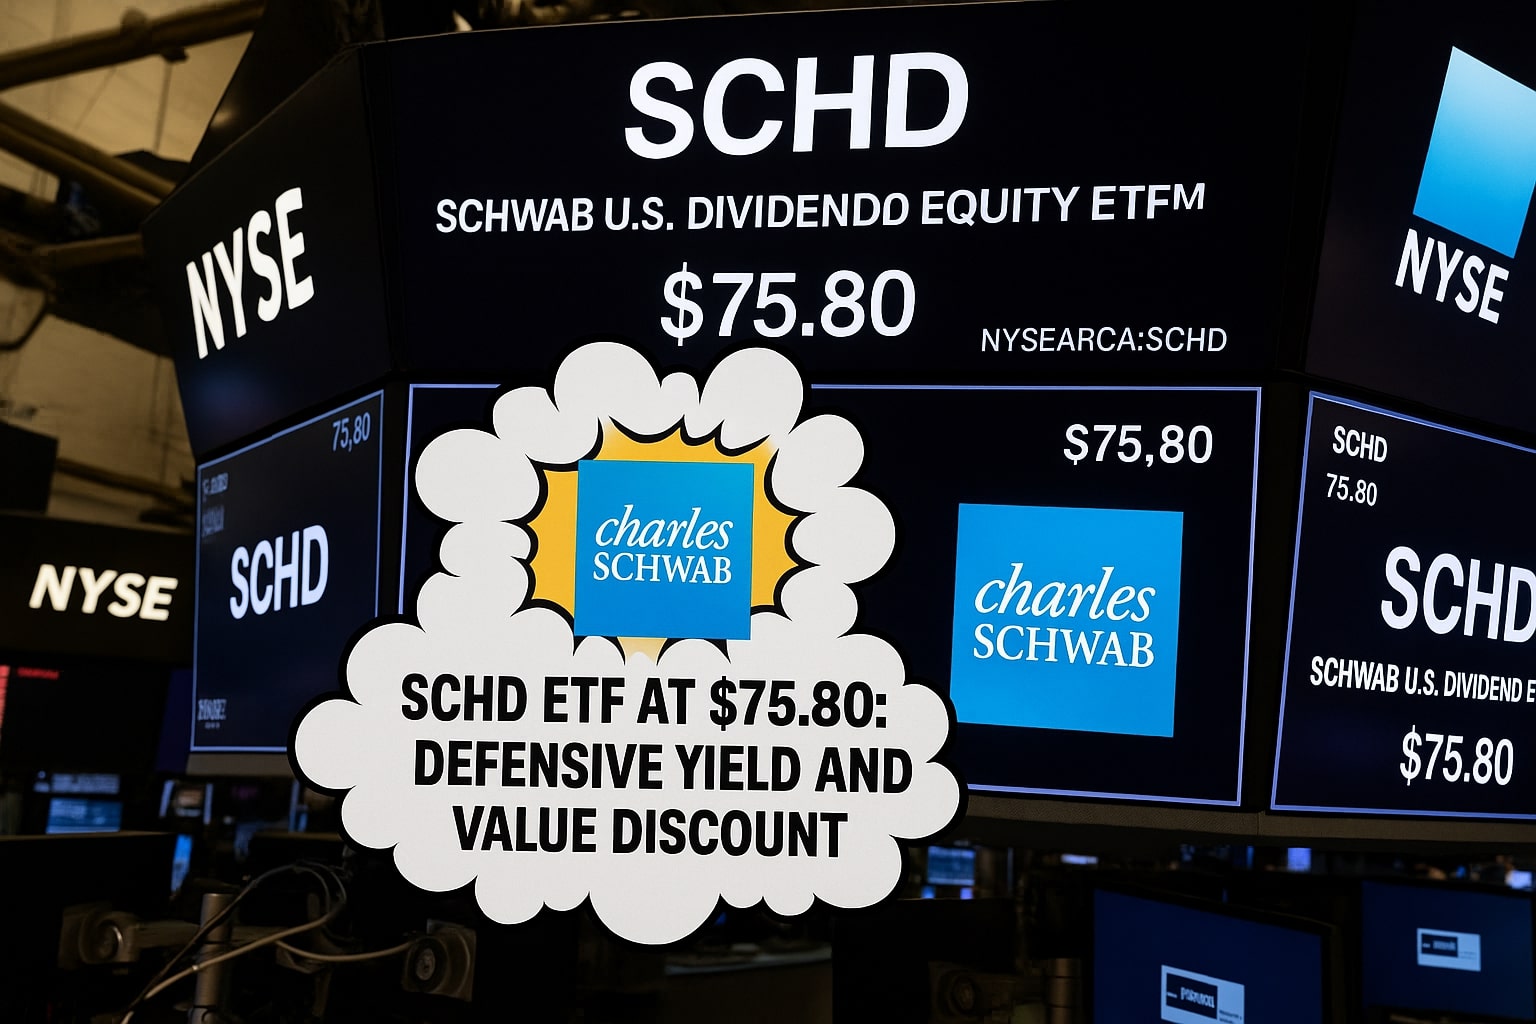
SCHD ETF at $75.80 Delivers 3.87% Yield and Trades 40% Below SPY Multiple

SCHD ETF at $75.80 Delivers 3.87% Yield and Trades 40% Below SPY Multiple

With its price near $75.80, a 16.2x forward P/E, top-10 holdings averaging 28% ROE and a near-historical high yield spread over SPY, SCHD stands out for income stability amid rising Treasury rates | That's TradingNEWS

TradingNEWS Archive 8/1/2025 9:32:56 PM
Stocks Markets TXN CSCO COP CVX

Financial Resilience Amid Mounting Uncertainty

The Schwab U.S. Dividend Equity ETF (NYSEARCA:SCHD) stands out as a fortress of steadiness in a landscape defined by trade disputes, shifting rate-cut expectations and geopolitical flare-ups. While the Federal Reserve has maintained its policy rate at 4.25–4.50 percent, SCHD’s 3.87 percent yield remains near a ten-year high, reflecting the defensive stance of its portfolio. A decade of reliable dividend growth and robust balance sheets has allowed these companies to absorb shocks that have left richly valued growth equities more exposed.

Dividend Yield and Valuation Contrast with SPY

With a forward price-to-earnings multiple of 16.2 times, SCHD trades significantly below the S&P 500’s 27 times, providing an attractive entry point for income-seeking investors. The ETF’s 3.8 percent distribution yield more than doubles the S&P 500 ETF’s 1.55 percent, driving a yield spread at historic extremes. These income streams are underpinned by constituents delivering an average 28 percent return on equity and a decade-long, 10.8 percent compound annual dividend growth rate.

Sector Weighting and Earnings Quality Under the Spotlight

Energy stocks comprise 19.2 percent of SCHD, more than six times the exposure in the S&P 500, while Consumer Staples (18.8 percent) and Health Care (15.5 percent) complete the top three sectors. This blend translates into a weighted average five-year earnings growth rate of 9.3 percent, illustrating that SCHD is not merely defensive but also positioned in businesses capable of expanding cash flows and sustaining payouts even as interest rates gyrate.

Interest Rate Dynamics and Correlation Analysis

Over the past decade, there has been no sustained inverse correlation between SCHD’s share performance (–0.15) or its dividends (+0.30) and 10-year Treasury yields. These coefficients have oscillated around zero, underscoring that dividend-focused value stocks often thrive in higher-rate environments. JPMorgan data further reveal that rising rates historically coincide with value outperforming growth, as inflationary pressures favor companies with durable pricing power and predictable cash flows—the hallmarks of SCHD’s methodology.

Geopolitical Catalysts: Trade Accord’s Impact on Energy Exposure

The newly ratified $750 billion U.S.–EU energy trade agreement through 2028 is poised to bolster SCHD’s energy holdings. Firms like Chevron and TotalEnergies, which together constitute nearly eight percent of the ETF, stand to benefit from increased export volumes as European buyers diversify away from regional suppliers. This demand infusion could offset margin pressure from rising borrowing costs and reinforce SCHD’s role as a hedge amid supply-chain volatility.

Regulatory Headwinds: Drug Price Control Risks for Healthcare Holdings

Healthcare represents 15.5 percent of SCHD, with Pfizer and Merck prominent among its top ten names. President Trump’s recent 60-day directive to lower prescription costs introduces regulatory risk that could compress pharmaceutical margins. While these companies’ strong balance sheets and sub-20 percent payout ratios provide a cushion, investors must monitor policy developments closely, as rapid shifts could dampen earnings growth and dividend trajectories.

Technical and Flow Considerations: NAV Premiums and ETF Demand

Year-to-date inflows into SCHD have averaged $400 million weekly, reflecting institutional confidence in its risk-adjusted return profile. The ETF boasts tight bid-ask spreads and a negligible NAV discount, even during equity sell-offs, underscoring its liquidity. Chart patterns indicate support near $68 and resistance around $74, suggesting a defined trading range that may compress further if volatility resurges.

Fundamentals & Yield

The Schwab U.S. Dividend Equity ETF – NYSEARCA:SCHD – commands a 3.87% current yield, up from its decade-long average of 3.11%. Its holdings boast an average Return on Equity of 28%, with long-term dividend CAGRs of 10.7% over ten years and 10.8% over five years. SCHD’s universe of cash-generative names has grown distributions uninterrupted since inception, translating into a dependable income stream that eclipses the 1.45% yield of the SPY and the 0.73% yield of the QQQ.

Valuation & Risk Profile

At a portfolio-weighted P/E of 16.2x, SCHD trades nearly 40% below the 27x multiple on the S&P 500. That discount reflects its focus on mature, cash-flowing businesses: the top 10 constituents average a dividend payout ratio of 44% and five-year earnings growth of 9.3%. Peak exposure to energy (19.2%), consumer staples (18.8%) and healthcare (15.5%) cushions the ETF in a rising-rate backdrop, but also concentrates earnings risk if sectors underperform.

Interest Rate Sensitivity

Historical correlation between SCHD’s share price and the 10-year Treasury yield hovers near zero (long-term average +0.05), challenging the notion that dividend-rich ETFs suffer systematically when rates rise. Value sectors typically outpace growth in high-rate regimes, and SCHD’s energy tilt benefits from higher commodity prices that often accompany inflationary periods. Nevertheless, a sustained 5%+ rate environment would compress earnings multiples and test the resilience of SCHD’s leverage-intensive holdings.

Portfolio Positioning & Diversification

With 33% of the portfolio anchored in SCHD itself, plus 10% in PDI and 10% in RQI, the fund allocation skews toward stable income vehicles. Its sector weights are balanced—no single sector exceeds 19%—and global exposure remains U.S.-centric. That conservatism suits defensive mandates, but limits upside in technology and international equities, which drive broader market gains when growth impulses return.

Technical Perspective

SCHD’s price has corrected 4.8% since the Fed’s late-July rate pause, finding near-term support at $67.50. RSI resides at 42, below neutral but above oversold, suggesting room for stabilization. A weekly close above $69.80 would signal re-entry strength; a breach below $66.20 risks a test of the 50-day moving average at $64.90 and could prompt defensive outflows.

Verdict

SCHD combines an attractive yield, rock-solid dividend growth and below-market valuation, yet faces mixed forces from rising rates, concentrated sector risk and limited cyclical upside. The risk/reward balance favors income-focused portfolios but lacks the dynamism for aggressive total-return strategies. On net, the recommendation is to Hold.

That's TradingNEWS