Stock Market Today - Nvidia $189 Puts S&P 6,910, Nasdaq 22,886 and Dow 49,626 on Edge
Wall Street pauses for Presidents Day with AI leaders NVDA and GOOGL driving gains, software sliding, valuations stretched by the 220% Buffett indicator and a 15% global tariff plan threatening the 2026 rally | That's TradingNEWS
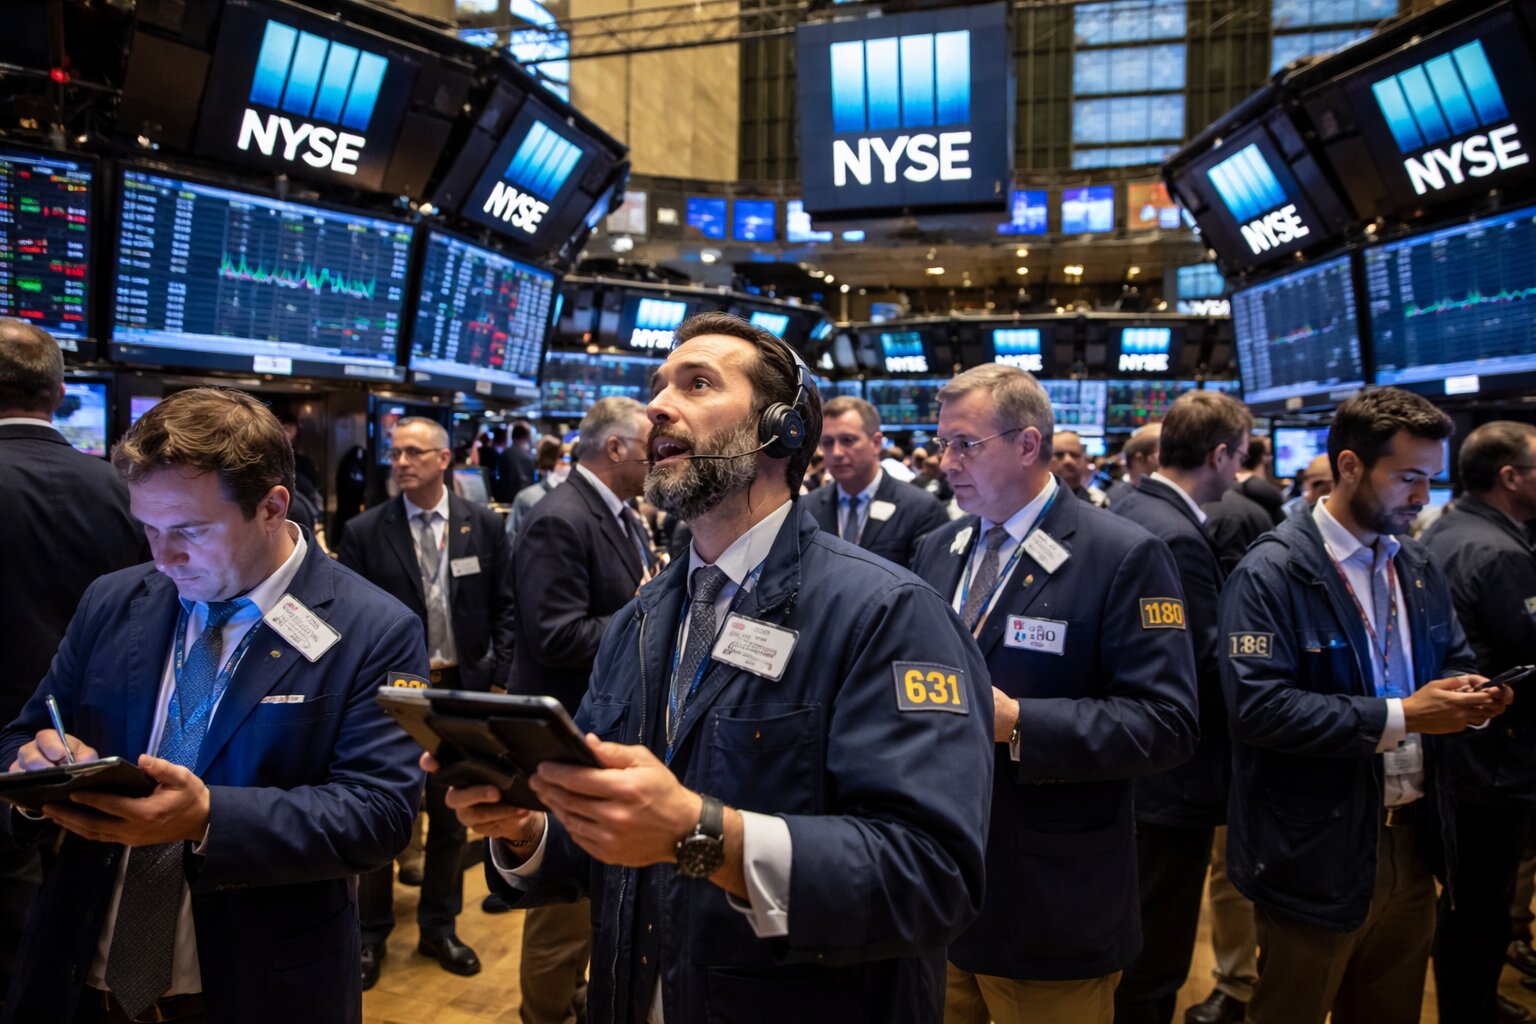
Stock market setup into Presidents Day week: indices, valuations and AI shock risks
With US cash markets shut for the Presidents Day holiday and trading resuming only on Tuesday, the big US benchmarks go into the week sitting close to record territory but with a very uneven risk profile. The S&P 500 (^GSPC) last closed around 6,910, up roughly 0.7% on Friday and about 0.2% year-to-date. The Nasdaq Composite (^IXIC) finished near 22,886, gaining about 0.9% on the day, while the Dow Jones Industrial Average (^DJI) ended close to 49,626, adding about 0.5%. Volatility, measured by the S&P 500 VIX, slipped toward 19.1 (down about 5.6% on the session), signaling unease but not full risk-off. Index futures into the long weekend reflect exactly that: a market still leaning bullish at the headline level, but nervous underneath about valuations, tariffs, AI spending and earnings concentration.
Range-bound S&P 500 with narrow tape and crowded support levels
Price action in ^GSPC has shifted from trending to sideways. The index has recently traded in a tight 6,833–6,879 band, clustering around the 50-day moving average near 6,890–6,900, while the 200-day moving average near 6,505 anchors the medium-term uptrend. Short-term volatility (ATR) sits around 79–80 index points, which is modest relative to the absolute level of the index and consistent with consolidation rather than panic. Momentum indicators underline this: RSI near 51.5 and ADX around 16–17 describe a weak trend, while MACD and Awesome Oscillator are slightly negative, showing fading upside momentum but not a breakdown.
Option-implied ranges are clear. The lower Bollinger band near 6,805 marks the first major support, with the upper band around 7,020 as primary resistance. The upper Keltner channel sits just above, around 7,056, acting as stretch resistance for any attempt at a breakout. A daily close above 7,020 would shift the tone back toward trend-follow buying. A decisive break below 6,805 opens room for a pullback toward the 6,700 region and, if that fails, a deeper test toward the 6,505 200-day. For Trading News, those are the critical numbers: above 7,020, momentum funds re-engage; below 6,805, risk systems start cutting exposure.
Buffett indicator near 220%: valuation pressure building on S&P 500 and peers
On valuations, the message is blunt. The Buffett indicator, which compares the total US stock market value to US GDP, sits around 220.1%. Over the last decade it mostly stayed in the 110%–150% band; even at the 2021–2022 peaks it was lower than now. At roughly 2.2× GDP, the market is priced for strong, sustained earnings growth and benign macro conditions. That does not guarantee a crash, but it does mean the margin for error is thin.
Macro houses such as Capital Economics and Goldman Sachs have already mapped out scenarios where a slowdown in earnings growth or a negative macro surprise leads to a double-digit percentage decline in ^GSPC. From current valuations, a move from high-20s to low-20s multiples on leading sectors is enough to erase a year of gains. The indicator is not a timing tool, but at ~220% it is a clear signal that broad, passive buying at any price is no longer a low-risk strategy. This backdrop is exactly why short-term support at 6,805 and medium-term support at 6,505 matter so much.
Repricing example TREX: from premium growth multiple to cyclical discount
The valuation reset in Trex Company (NYSE:TREX) is a live case study of what elevated multiples can look like on the way down. TREX has dropped more than 35% over the past year as higher interest rates in the US and UK cooled home-improvement demand, inventory reductions bit into volumes, and 2025 earnings missed expectations. Its current price-to-earnings ratio around 23 now sits well below its long-term average near 33.
That shift is not about the company becoming structurally broken; it is about the market refusing to pay a previous growth-stock multiple once the macro tailwind and earnings surprise cycle faded. In a market where the aggregate Buffett indicator is over 220%, TREX is the template: good businesses can see substantial multiple compression without any macro crisis, just from the gap between old expectations and the new reality.
AI trade stress test: NVDA earnings as the key volatility event
The next major test for risk appetite sits squarely in Nvidia Corp. (NASDAQ:NVDA). After soaring more than 1,500% from late 2022 to the end of 2025, NVDA is only up around 0.8% so far in 2026. The stock carries roughly a 7.8% weighting in the S&P 500, so any outsized move will feed directly into ^GSPC and ^IXIC.
For its upcoming fiscal fourth quarter, NVDA is expected to deliver roughly a 71% year-on-year jump in EPS on revenue around $65.9 billion. Street estimates for the coming fiscal year cluster around $7.76 EPS, implying about 66% EPS growth, but the spread is wide: low-end estimates sit near $6.28, while the top of the range reaches about $9.68. That dispersion matters. If realized EPS guidance lands near the high end, current valuations look demanding but defensible. If guidance hints closer to the low end, the re-rating could be sharp.
AI “hyperscalers” have already flagged aggressive data-center capex plans, and much of that spend flows through NVDA’s GPUs and networking stack. Comments from CEO Jensen Huang on the call will therefore extend beyond one ticker: they will inform the entire AI infrastructure complex and the megacap cohort that has led the US indices for years.
Nasdaq leadership reshuffle: MSFT and AMZN lag while NVDA and GOOGL carry the AI flag
Beneath the Nasdaq headline gain, leadership is rotating hard. Among the so-called “Magnificent Seven”, Microsoft (NASDAQ:MSFT) is down more than 17% year-to-date and Amazon.com (NASDAQ:AMZN) has slid about 11%, even as ^IXIC holds near 22,886. After a multi-year run where a handful of megacaps drove index returns, the market is now punishing any sign of AI disruption risk or margin pressure in software and cloud.
At the same time, NVDA and Alphabet (NASDAQ:GOOGL) are acting as shock absorbers. Their ability to monetize AI infrastructure and models is increasingly treated as the benchmark for the whole theme. That concentration creates fragility: a weak print or cautious tone from NVDA or GOOGL can pull the entire Nasdaq lower regardless of what smaller names do. The week ahead, with NVDA’s results and a crowded AI narrative, will go a long way to deciding whether ^IXIC extends above 22,900 or slides back toward prior support zones.
Read More
-
VOO ETF Price Near $634 as AI Capex and Tariff Shock Rewire the S&P 500
22.02.2026 · TradingNEWS ArchiveStocks
-
XRP ETF XRPI And XRPR: $1.40 XRP, $4B Ripple Deals And A Tight Supply Squeeze
22.02.2026 · TradingNEWS ArchiveCrypto
-
Natural Gas Price Near $3.05 as Bomb Cyclone and Global Supply Stress Collide
22.02.2026 · TradingNEWS ArchiveCommodities
-
USD/JPY Price Forecast: Yen Shock Turns 155 Into a Make-or-Break Level
22.02.2026 · TradingNEWS ArchiveForex
Alphabet’s Gemini rollout: GOOGL combines AI momentum with heavy capex
Alphabet (GOOGL) just delivered a clean outperformance day that underlines its growing AI influence. The stock closed Friday at about $314.98, up 4.01% on the session, with trading volume near 51.9 million shares, roughly 38% above its three-month average around 37.5 million. Since its 2004 IPO, the name has gained roughly 12,449%, and it remains one of the dominant weights inside the Nasdaq and S&P 500.
The latest move was driven by an expanded rollout of the Gemini AI model into enterprise products and a new commerce partnership in Asia, both of which broaden distribution for high-margin, AI-enhanced services. The tension is capital intensity. Alphabet has flagged $175–$185 billion of AI infrastructure spending planned for 2026, a scale that initially triggered concern around margins and free cash flow. The market is now leaning toward the view that, starting from a position of strong cash generation and low leverage, that capex can be absorbed if AI revenues ramp at pace.
Peers in the interactive media and services pocket reinforced the theme. Meta Platforms (NASDAQ:META) closed near $655.66, up about 1.69%, while MSFT finished at $397.23, down 0.31%, highlighting that not all megacaps are treated equally. Those deploying AI to expand their core advertising and cloud cash engines are being rewarded. Those facing AI-driven disruption to incumbent software models are under pressure.
Software, infrastructure and second-order AI losers: CRM, INTU, DELL and CoreWeave
The S&P 500 software and services index is down roughly 20% so far this year, a stark contrast to the flat-to-slightly positive ^GSPC print. The market is re-pricing the entire group around one question: which business models can defend pricing power once generative AI commoditizes more workflows?
Names like Salesforce (NYSE:CRM) and Intuit (NASDAQ:INTU) report in the coming week with that overhang. Both sit in segments where AI can automate a meaningful slice of what their platforms charge for. The setup is asymmetric: strong prints may be sold on relief if guidance is cautious on AI, while any hint of margin compression or slower seat growth can accelerate the de-rating already underway across the sector.
On the hardware and infrastructure side, results from Dell Technologies (NYSE:DELL) and private players like CoreWeave will feed into the same question from a different angle: can AI-linked capex at the hyperscalers translate into durable earnings growth for the broader supply chain, or is the market over-discounting a one-cycle boom? For Trading News, this is where dispersion will be most violent next week.
Tariff shock and Supreme Court ruling: macro overhang for Dow, multinationals and consumption
Trade policy has re-emerged as a market risk. A US Supreme Court decision striking down earlier sweeping tariffs introduced by President Donald Trump initially boosted equities and pushed Treasury yields higher, as markets interpreted the ruling as a modest relief on global trade frictions. That reprieve was short-lived. The administration has now signaled a move to impose a 15% global tariff rate, despite the legal setback.
For Dow heavyweights with global supply chains and international revenue exposure, that path matters more than day-to-day noise in DC. A broad 15% tariff regime would hit import costs, invite retaliation, and weigh on margins for industrials, autos, consumer discretionary and tech hardware. Research from shops like BCA also warns that even a 10% equity market drop linked to such shocks could meaningfully dent US consumption through wealth effects. The equity tape is not pricing a full trade war, but it is increasingly sensitive to every headline on this front.
Sector rotation: 2025 winners fade while energy, industrials and staples pick up the slack
The index-level resilience masks a sharp rotation. Everything that worked in 2025 – megacap growth, high-multiple software, long-duration earnings stories – is facing a tougher 2026. In contrast, sectors that lagged the prior cycle are starting to carry more of the load.
Energy, industrials and consumer staples have seen inflows as investors look for earnings visibility and pricing power that do not depend on constant multiple expansion. Within tech, pockets tied directly to AI infrastructure (chips, select hardware, cloud platforms with strong AI attach rates) are still seeing support, but the rest of the complex is fragmenting. For ^GSPC, that rotation is healthy in the short term because it broadens participation. For stock-picking, it forces a much more selective stance: broad beta is no longer enough.
Risk signals for the new week: breadth, credit, volatility and key index levels
Several indicators will dictate whether the current sideways pattern resolves higher or rolls over:
Breadth needs to improve, not deteriorate. Equal-weight indices should avoid persistent underperformance versus cap-weight. Credit spreads and the VIX term structure must remain contained; a spike in front-end volatility relative to back-end would signal demand for downside hedges. Real yields are another pressure point: a renewed move higher would hit long-duration growth names again.
On price, 6,805 on the S&P 500 (lower Bollinger band) remains the first line of defense, with the 50-day near 6,890–6,900 acting as the pivot and 7,020–7,056 as the resistance zone. A close above 7,020 after the holiday would tell you the market is willing to look through tariff headlines and AI volatility. A break below 6,805 alongside widening credit spreads would raise the probability of a move toward 6,700 and then the 6,505 200-day.
How AI grading and forecasts frame the S&P 500 risk/reward right now
AI-driven scoring and forecasting tools, such as those used by platforms like Meyka, currently assign the S&P 500 (^GSPC) a grade around C+ with a numeric score near 58.5, which effectively labels the index as neither cheap nor catastrophically overbought, but vulnerable. Short-term modeling points to a potential one-month mean path closer to 6,183.63, while a one-year central path sits around 7,066.67.
That profile matches what price and valuations are already signaling. Over a 12-month horizon, a modest advance from current levels is plausible if earnings hold and AI capex converts into revenue. Over a 1-month horizon, the downside skew is real if NVDA disappoints, tariffs escalate, or the Buffett indicator proves to have overshot. For Trading News readers, that is the trade-off: time horizon determines whether the current setup is attractive or fragile.
Trading News stance: cautious hold on S&P 500, selective buy in AI leaders, avoid broad sell
Pulling it together, the numbers point to a nuanced stance going into the new week after the Presidents Day break. The major indices – S&P 500, Nasdaq, Dow – are not in obvious topping patterns, but they are extended on valuations and highly dependent on a small set of AI-linked names and a benign macro backdrop. The Buffett indicator near 220%, the concentration of gains in NVDA and GOOGL, the drawdown in software and the renewed tariff threat all argue against aggressive index-level buying at this altitude.
At the same time, support around 6,805 on ^GSPC, a still-contained VIX near 19, and ongoing sector rotation into energy, industrials and staples do not justify an outright, across-the-board sell stance. From a pure risk–reward perspective, the setup aligns with a cautious hold on the broad indices, a selective buy bias on AI infrastructure leaders like NVDA and GOOGL on weakness, and a defensive posture toward richly valued software where AI disruption risk is not yet fully reflected.
As trading restarts after the holiday, the key is discipline around the levels: respect 6,805 and 6,505 as the guardrails on ^GSPC, watch NVDA’s print and Huang’s tone as the trigger for AI sentiment, and treat any spike in credit spreads or front-end volatility as a signal to tighten risk quickly.