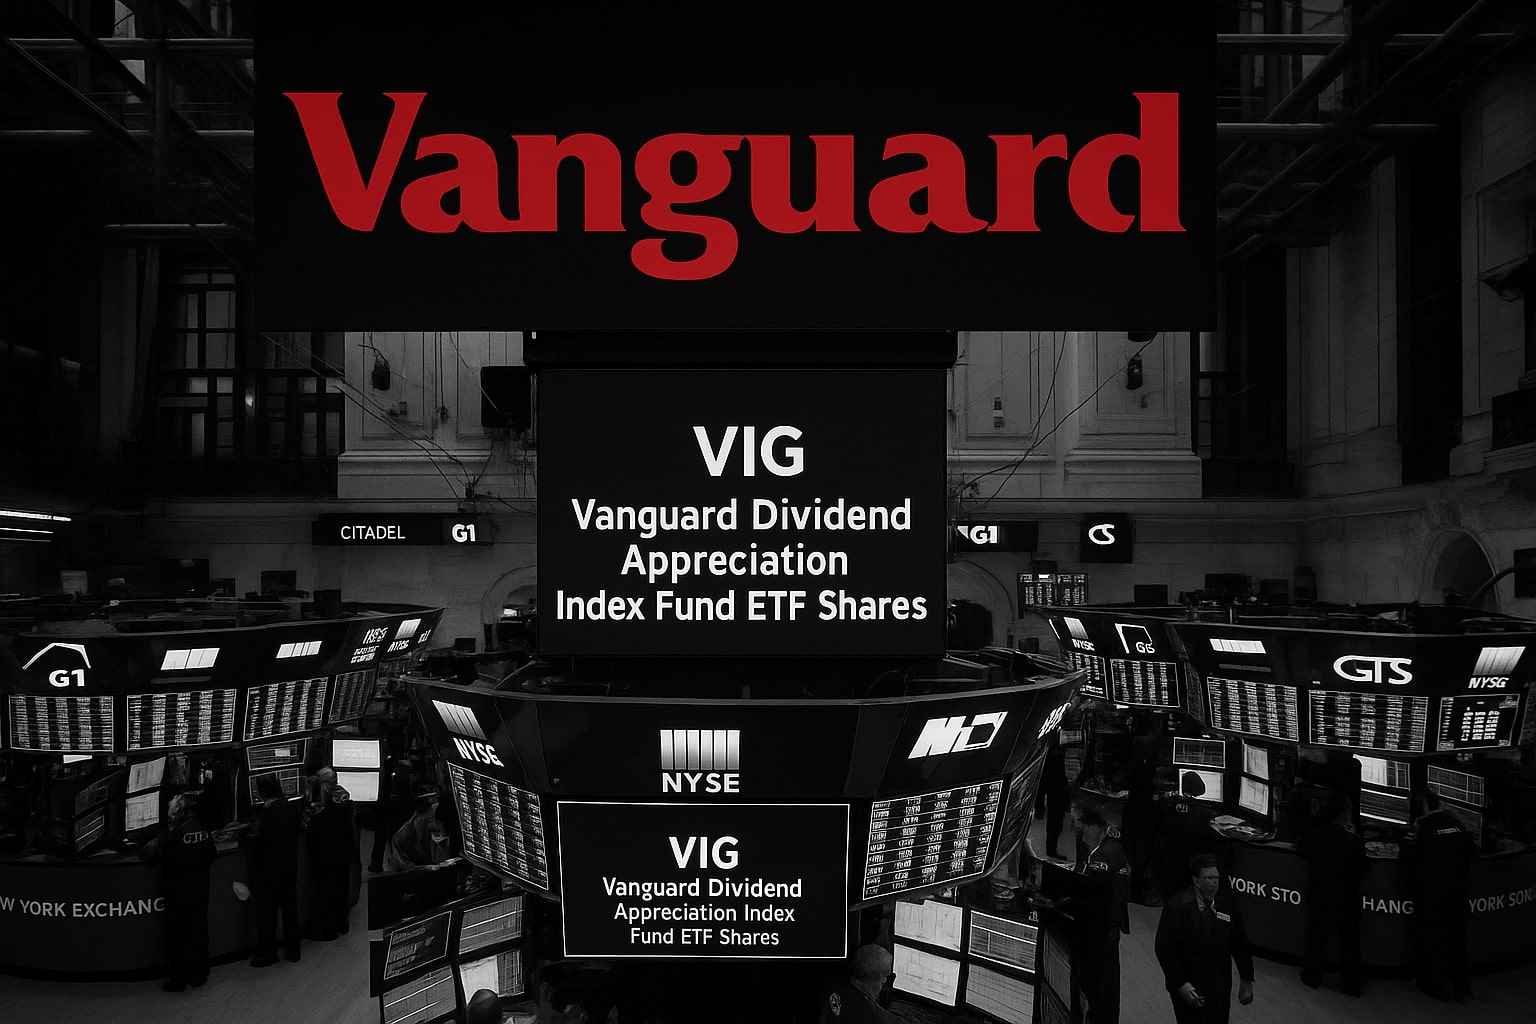
Vanguard Dividend Appreciation ETF (VIG) Holds $216 as Dividend Growth Strategy Proves Its Strength Against SCHD and VYM in a Yield-Heavy Market
The Vanguard Dividend Appreciation ETF (NYSEARCA: VIG) remains one of the market’s steadiest barometers for long-term income investors. Trading around $216.25 (-0.41%), the fund has outperformed the broader dividend universe through 2025, supported by its disciplined focus on companies with a minimum ten-year record of consecutive dividend increases. That simple rule, backed by Vanguard’s low-cost structure (0.06% expense ratio) and broad sector diversification, has helped VIG deliver a 13.4% total return year-to-date, slightly ahead of SCHD’s 12.1% and VYM’s 9.8%. Its 12-month yield of 1.85% looks modest compared with peers, but the ETF’s true power lies in the 6–8% annual dividend-growth rate embedded in its holdings, led by Microsoft (NASDAQ: MSFT), Visa (NYSE: V), and Johnson & Johnson (NYSE: JNJ).
VIG’s $94 billion in assets under management place it as the largest dividend-growth ETF globally. The composition tilts toward quality-growth megacaps, with information technology (21%), industrials (19%), and health care (15%) dominating the allocation. This bias has insulated VIG from the volatility hitting high-yield funds during 2025’s rate-reset cycle. When the 10-year Treasury yield climbed back above 4.6%, dividend-value ETFs such as Schwab U.S. Dividend Equity ETF (SCHD) and Vanguard High Dividend Yield ETF (VYM) saw capital outflows of nearly $1.2 billion combined, while VIG quietly attracted $640 million in net inflows in Q3 alone — proof that investors favor dividend consistency over headline yield.
The ETF’s performance owes much to its methodology: VIG tracks the S&P U.S. Dividend Growers Index, which systematically excludes the highest-yielding but unstable payers. As a result, its median payout ratio stands at 46%, far below SCHD’s 61% and VYM’s 67%, giving its constituents room to expand dividends even if earnings flatten. Over the past five years, the fund’s dividend per share has risen from $2.16 in 2020 to $2.91 in 2025, a 35% increase. With reinvested distributions, that translates to a five-year total return exceeding 71%, comfortably beating both the S&P 500 Value Index (+63%) and the Dow Jones Dividend Select (+57%).
The biggest engine remains technology. Microsoft and Apple (NASDAQ: AAPL) together account for more than 8% of assets, but their dividend yields — 0.7% and 0.5% respectively — belie rapid payout acceleration: Microsoft’s dividend per share has grown 10% CAGR over the past decade. The same compounding strength runs through Visa, UnitedHealth (NYSE: UNH), Home Depot (NYSE: HD), and PepsiCo (NASDAQ: PEP), each contributing to VIG’s resilience during cyclical drawdowns. The portfolio’s weighted-average return on equity (ROE 29%) and three-year earnings-growth rate (11%) confirm that it is not a “bond-proxy” ETF but a quality-growth fund with defensive cash flows.
By contrast, SCHD’s 3.6% yield continues to appeal to income-maximizers but at the cost of concentration — nearly 40% of SCHD’s portfolio sits in financials and energy, sectors that have underperformed amid narrowing net-interest margins and volatile crude prices. VYM carries an even higher yield near 3.4% but with slower dividend growth and heavier exposure to cyclical value names like Chevron (NYSE: CVX) and JPMorgan Chase (NYSE: JPM). DGRO, iShares’ rival dividend-growth ETF, mirrors much of VIG’s philosophy but charges 0.08% and maintains a smaller base of $31 billion AUM, which limits liquidity for institutional allocators.
A newer entrant, TGLR ETF, positioned as a “Top Growers” dividend hybrid, has gained traction in 2025 with $2.3 billion AUM and a 9.2% YTD return, but its shorter history and higher turnover make it a complement rather than a substitute. When back-tested over a ten-year horizon, a portfolio split 70% VIG / 30% SCHD generated 11.7% annualized returns with 13% volatility, outperforming either fund individually — a testament to VIG’s stabilizing influence.
From a valuation perspective, VIG trades at a forward P/E of 21.8× versus SCHD’s 16.2× and VYM’s 14.9×, yet investors appear willing to pay that premium for earnings reliability and balance-sheet strength. The fund’s top-ten holdings carry net-cash positions exceeding $320 billion combined, and nearly 90% of constituents boast investment-grade credit ratings. Even in a higher-for-longer rate environment, that quality cushion protects VIG from deep drawdowns. Its beta of 0.83 and three-year standard deviation (13.6%) show that the ETF delivers smoother compounding than broader equities.
The macro backdrop reinforces its appeal. As inflation moderates toward 2.5% and the Federal Reserve edges closer to rate cuts in 2026, dividend-growth equities are regaining relative performance. Historical data from 2001–2024 reveal that VIG’s strategy outperforms both high-yield and broad-market indices during early-easing phases by an average of 280 basis points per year, due to margin expansion and multiple re-rating. Moreover, VIG’s underlying companies have consistently increased free cash flow by 7–9% annually, a pace that supports dividend hikes regardless of GDP fluctuations.
Vanguard’s stewardship and low costs amplify that edge. At $216 per share, investors are effectively paying $6 per $10,000 invested annually — one of the lowest expense burdens in global equity markets. Over 15 years, that compounding cost advantage adds roughly 70 basis points to total return versus competitors charging 0.3% or higher. For long-term savers and pension allocators, those incremental gains matter more than temporary yield differentials.
From a technical standpoint, VIG remains in a strong intermediate uptrend, with its 50-day moving average around $214 and the 200-day at $203. The relative strength index (RSI 58) points to a consolidation phase rather than exhaustion. The ETF’s support zone lies between $212 and $210, where institutional buying has consistently reappeared since June. A breakout above $220 could trigger another leg higher toward $228–$230, mirroring the late-2023 pattern when dividend-growth stocks led the market into year-end.
For investors comparing the universe of dividend vehicles, VIG occupies a distinct middle ground: it sacrifices some yield for durability but rewards patience with consistent capital appreciation and tax-efficient compounding. The reinvested payout stream, growing roughly 7% per year, outpaces inflation and cushions total return during market drawdowns. As the global hunt for income transitions from pure yield to “quality yield,” funds like VIG are likely to dominate core equity allocations.
At current levels near $216, VIG’s forward dividend of $2.91 per share implies a payout growth trajectory that can reach $3.25 by 2026 under consensus estimates. That may not excite momentum traders, but for long-term investors seeking a defensive growth anchor, the numbers reinforce a simple conclusion: VIG remains the benchmark for sustainable dividend investing, blending stability, compounding, and scalability in one of the cleanest structures available on the U.S. market.
That's TradingNEWS


